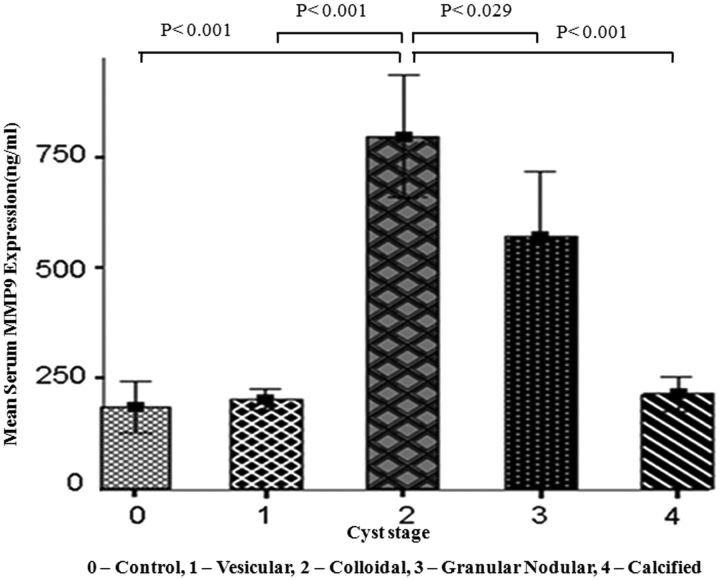
Fig 4.
Bar diagram shows the mean level of serum MMP-9 expression in the control and various stages of the cyst. The colloidal stage shows a significant difference from the control, vesicular, granular-nodular, and calcified stages. The granular-nodular stage shows a significant difference from the control, vesicular, colloidal, and calcified stages. It also shows no significant difference between the control, vesicular, and calcified stages.

