Figure.

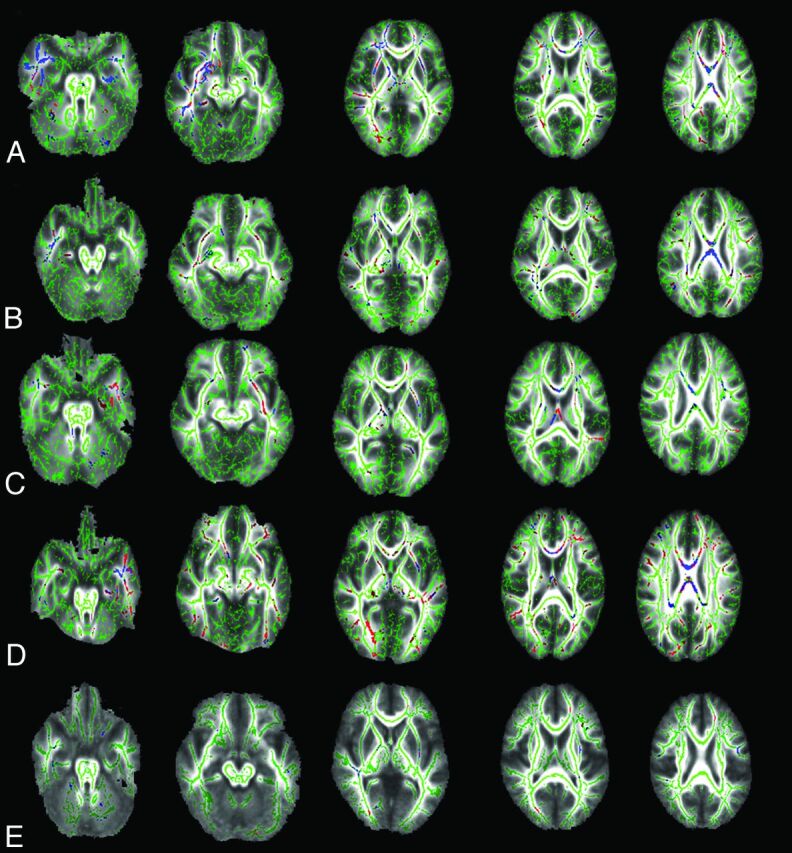
The TBSS (family-wise error–corrected threshold-cluster extend voxel P maps) reveal regions of significantly reduced FA (red) and increased MD (blue) in female patients with right HS (A), male patients with right HS (B), female patients with left HS (C), and male patients with left HS (D) compared with sex-matched and age-matched control groups at P < .05. E, The TBSS of women vs men within the whole control group show that men have few voxels with lower FA (red) and higher MD (blue) than women. FA skeleton that represents the center of the main WM tracts is shown in green on mean FA map.
