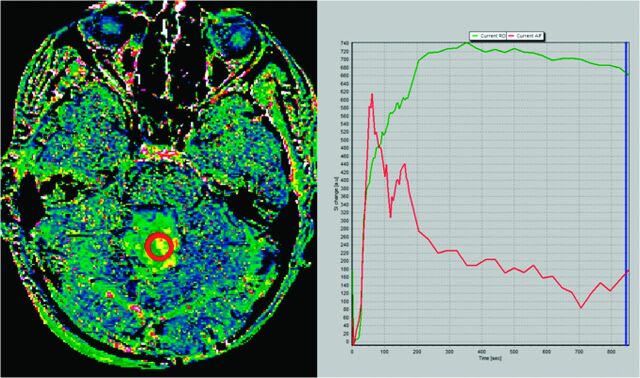
Fig 1.
Kep map obtained at 14 minutes in a cerebellar pilocytic astrocytoma (left image). Green curve represents the time–signal intensity curve of a region of interest (red circle in left image); red curve represents measured arterial input function; blue line corresponds to the last image considered for calculation (14 minutes) (right image). Kep value calculated for the whole 14-minute DCE study was 0.13 minutes−1.

