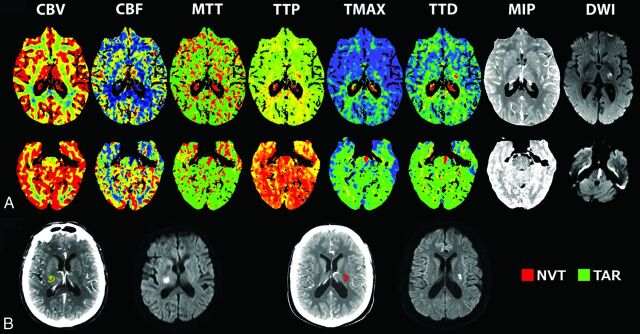
Fig 2.
Neuroimaging methods. A, CTP maps and DWI lesions in a patient with a supratentorial lacunar infarct (upper row) and in a patient with a brain stem paramedian infarct (lower row). B, Representative examples of the quantification of NVT and TAR and the final DWI lesion in a patient with mismatch (left) and a patient with no mismatch (right). NVT indicates nonviable tissue; TAR, tissue at risk.

