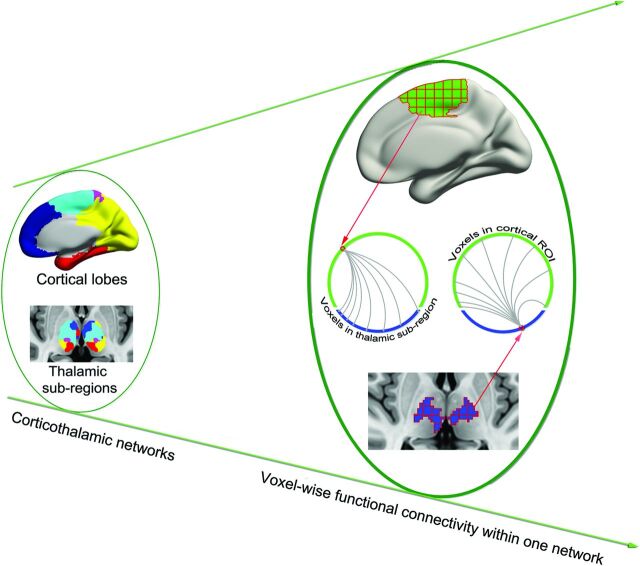
Fig 1.
Schematic of data analysis. From the left to right planes, 5 corticothalamic networks were first identified; FCS was then calculated for each voxel within the corresponding corticothalamic network. For example, 1 voxel in the cortical lobe was correlated with all voxels in the corresponding thalamic subregion. All superthreshold coefficient values were averaged to obtain the FCS of the cortical voxel.

