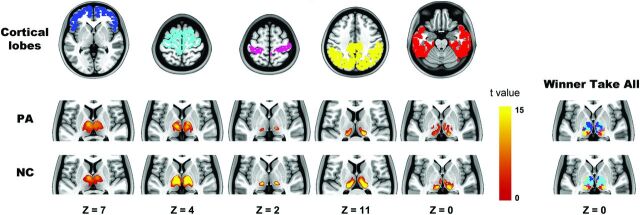
Fig 2.
Highly specific connections between the cortical lobe and thalamus. The 5 columns on the left show the cortical lobe and highly correlated thalamic regions in patients with IGE and healthy controls. In the winner-take-all map, each thalamic voxel is labeled according to the cortical lobe with the highest t value. The z plane coordinates indicate the Montreal Neurological Institute space.

