Fig 1.
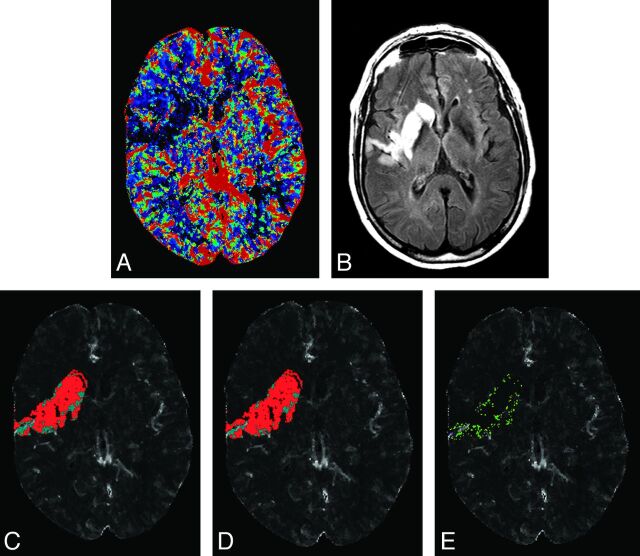
Admission CBF (A) and 7-day follow-up FLAIR (B) of a 74-year-old man with an ICA and M1 branch occlusion scanned 168 minutes after symptom onset and administered intravenous rtPA. The region of abnormality on follow-up FLAIR is coregistered to CBF and thresholded on the basis of without (C) and with covariate (D) thresholds from Table 1. Red voxels present predicted infarct, and cyan voxels present predicted noninfarct tissues on C and D. E, A subtraction of C and D representing voxels that were designated as infarcted tissue (green) and noninfarcted (pink, very few mainly located adjacent to blood vessels on E) only on the model with covariates.

