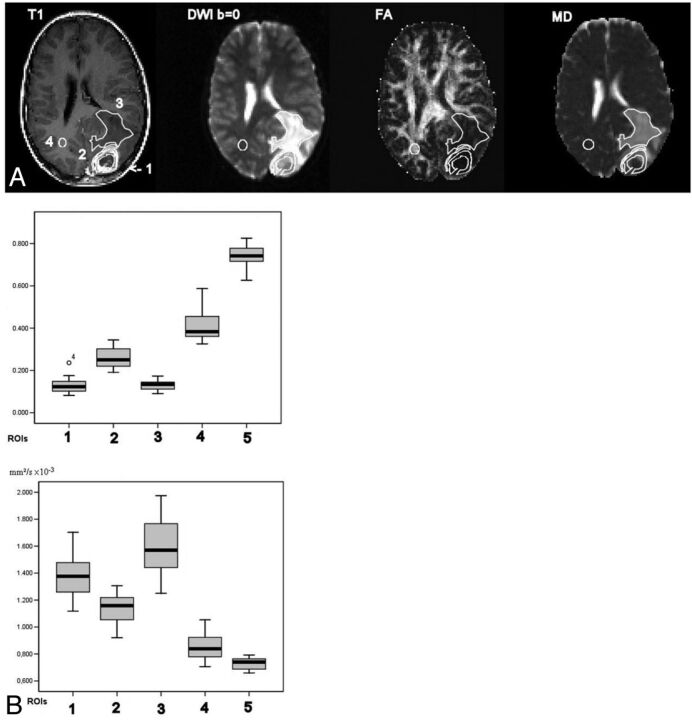
Fig 4.
FA and MD results from a patient with glioblastoma. A, Placement of ROIs. Arrangement of images and ROIs as in Fig 1A. B, FA (upper graph) and MD (lower graph) values and SD boxplots in high-grade gliomas. Numbers 1–5 correspond to ROIs as indicated in Fig 3A. Reprinted with permission from Tropine et al.25

