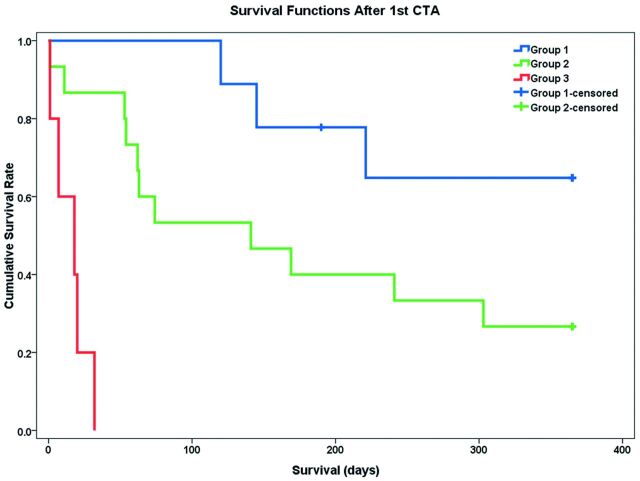
Fig 3.
Kaplan-Meier survival curves with pair-wise log-rank test show group 1 (blue, no pseudoaneurysm/extravasation/exposed artery on CTA) has the best survival rate, followed by group 2 (green, with pseudoaneurysm/extravasation/exposed artery on CTA and treated by permanent artery occlusion), and the worst survival is noted in group 3 (red, with pseudoaneurysm/extravasation/exposed artery on CTA but not treated by permanent artery occlusion).

