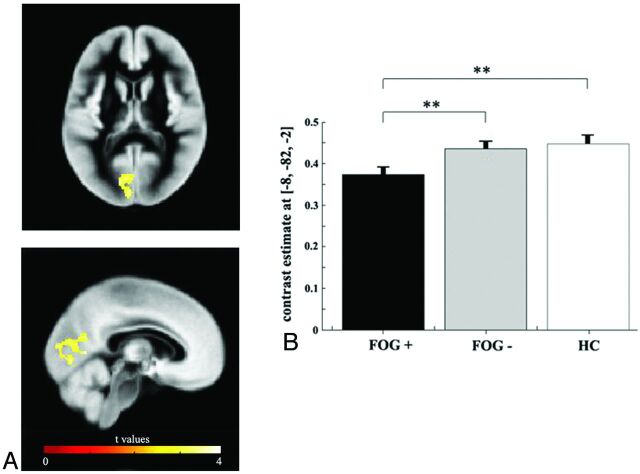
Fig 1.
A, Areas of GM tissue loss deriving from the direct comparison between patients with FOG+ and those with FOG−. The peak differences can be found within the left cuneus, precuneus, lingual gyrus, and posterior cingulate cortex. Results are superimposed on representative axial and coronal sections of the customized GM template, at a threshold of P ≤ .05, FWE-corrected. B, Mean GM volume loss (± standard error of the mean) extracted from the region (Statistical Parametric Mapping coordinates x: −8, y: −82, z: −2) showing a maximal statistical difference between groups. Double asterisks indicate significance at the whole-brain statistical threshold corrected for multiple comparison, (P ≤ .05, FWE-corrected).

