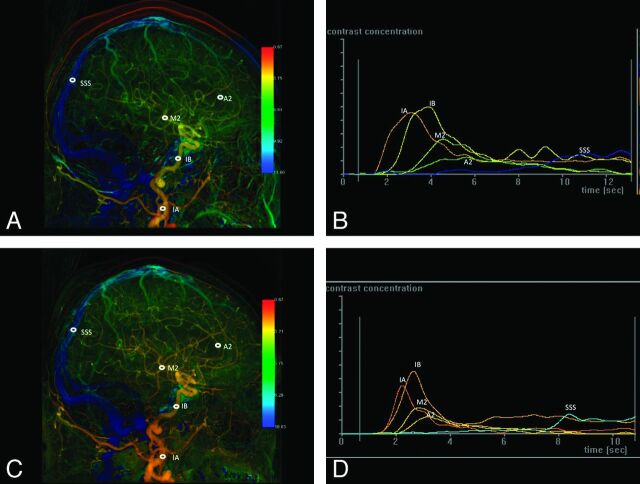
Fig 4.
A, Lateral view of color-coded left carotid artery DSA of a 78-year-old man with 90% stenosis of the left proximal ICA. Before stent placement, 5 ROIs were selected in the following order: cervical portion of ICA (IA), cavernous portion of ICA (IB), the second portion of ACA (A2), the temporal branch of MCA (M2), and SSS. B, Time-attenuation curves of the selected ROIs in A. C, Lateral view of the color-coded left carotid artery DSA of the same patient after stent placement. The same 5 selected ROIs as in A. D, After stent placement, the time-attenuation curves of the arterial ROIs become steeper and their Tmax values shorter, whereas no interval change of the waveform of SSS is evident compared with the corresponding waveform before stent placement in B.

