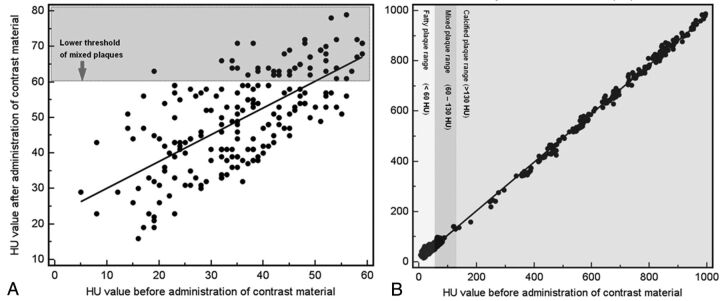
Fig 2.
Scatterplots with regression lines (A, B) that show the effect of contrast material administration in plaque classification. In panel A, the analysis of HU values before and after administration of contrast material in the 206 plaques that showed <60 HU in the unenhanced acquisition is given, whereas in panel B, the analysis of HU values before and after administration of contrast material in all the 607 plaques is given.

