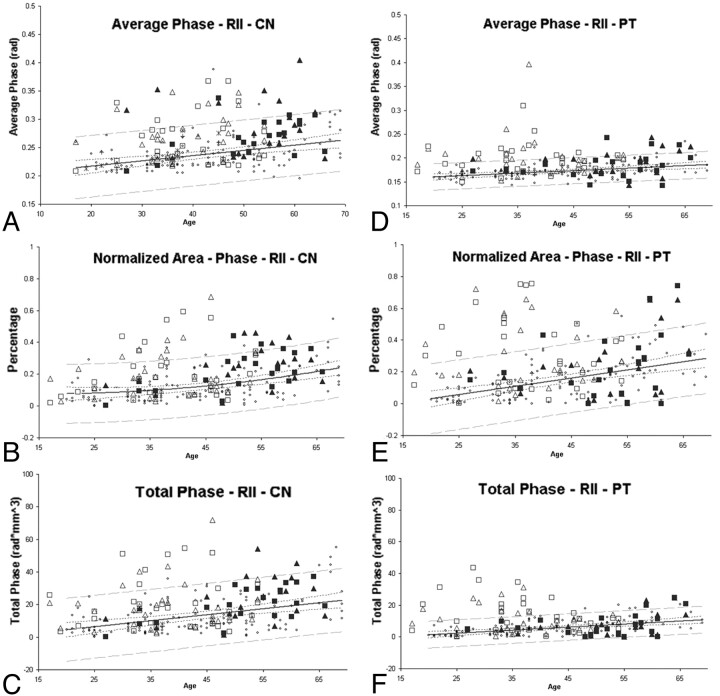
Fig 2.
Average phase, normalized area, and total phase of RII in the CN and PT. Small dots represent healthy subjects. The solid line is the regression line, and the outer dashed lines represent the 95% prediction interval of the regression. Hollow squares and triangles represent patients with RRMS, and the solid squares and triangles represent patients with SPMS. The squares and triangles represent the left and right hemispheres respectively. Many of the patients with MS have brain iron content beyond the 95% prediction intervals.

