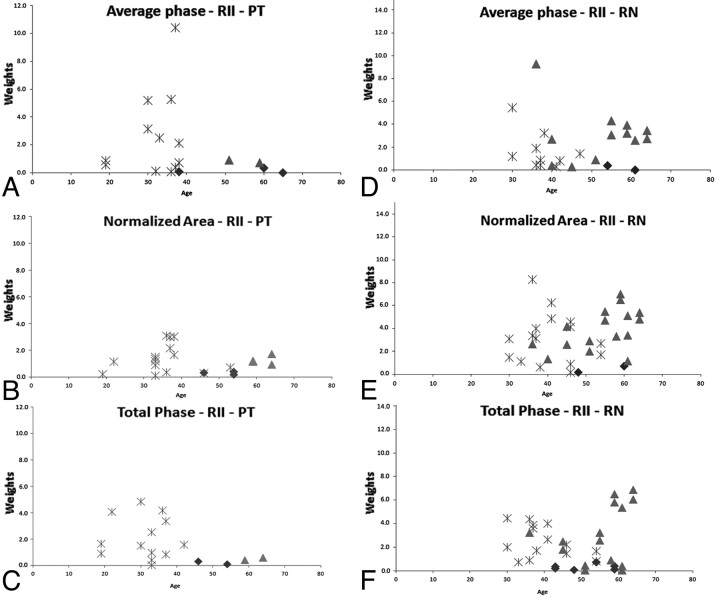
Fig 3.
Plots showing individual weighting of different parameters (average phase: upper row; normalized area: middle row; and the total phase: lower row) of the PT (A−C) and the RN (D−F). The asterisks represent the patients with RRMS, the triangles represent those with SPMS, and the diamonds represent the healthy subjects. Patients with MS and healthy subjects with weighting higher than 1 are shown in the plots (these results correspond to m = 3; for quantitative evaluation, please refer to Tables 1 and 2).

