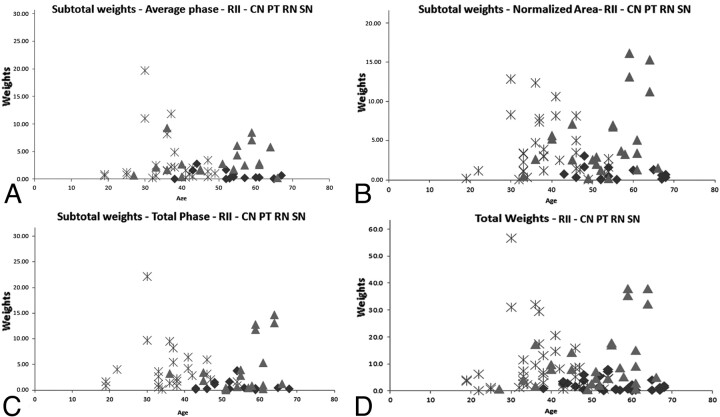
Fig 4.
Four plots showing the subtotal (A−C) weighting factors and the total weighting factor (D) of the 4 structures with the weighting factor >1 (these results correspond to m = 3): CN, PT, RN, and SN. The asterisks represent the patients with RRMS, the triangles represent the patients with SPMS, and the diamonds represent healthy subjects. For quantitative results of these graphs, please refer to Table 3.

