
Fig 4.
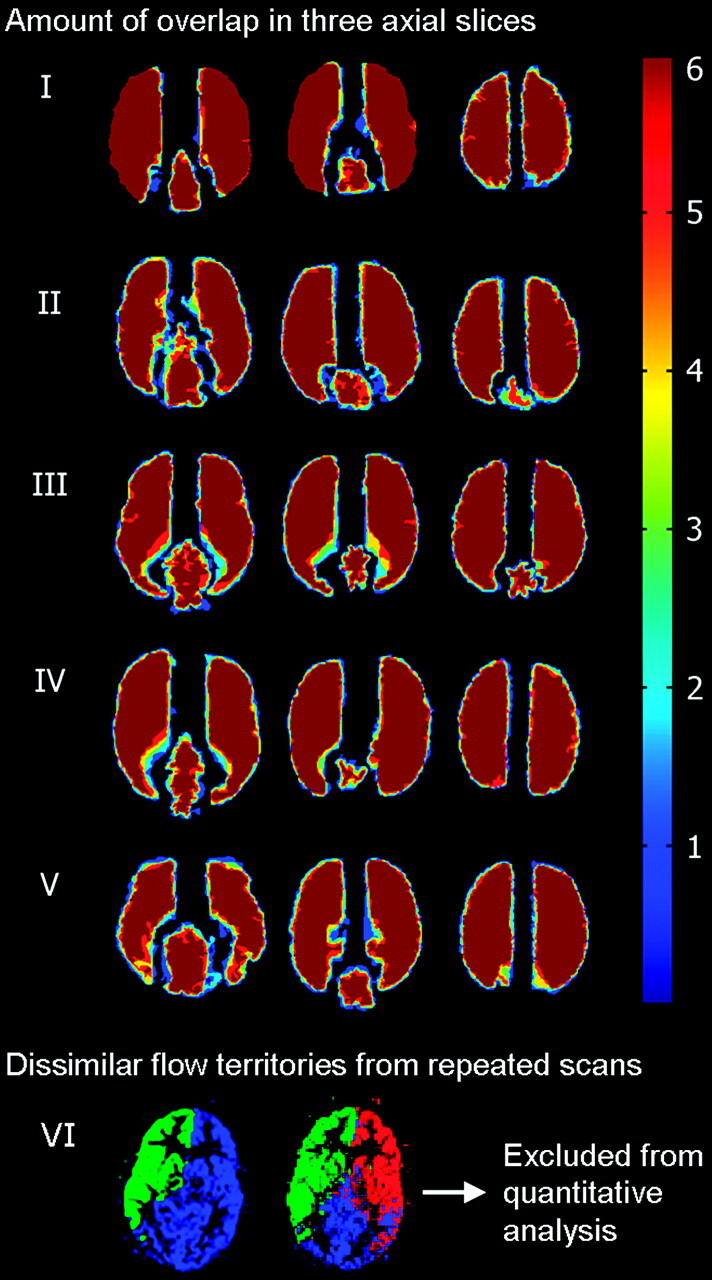
Three axial sections in 5 volunteers who were included in the quantitative analysis show the amount of overlap of flow territories from all sessions and sites (dark blue 1, light blue 2, green 3, yellow 4, red 5, and dark red 6 territories overlapping) and dissimilar flow territories obtained from repeat scanning in 1 volunteer who was excluded from further analysis.