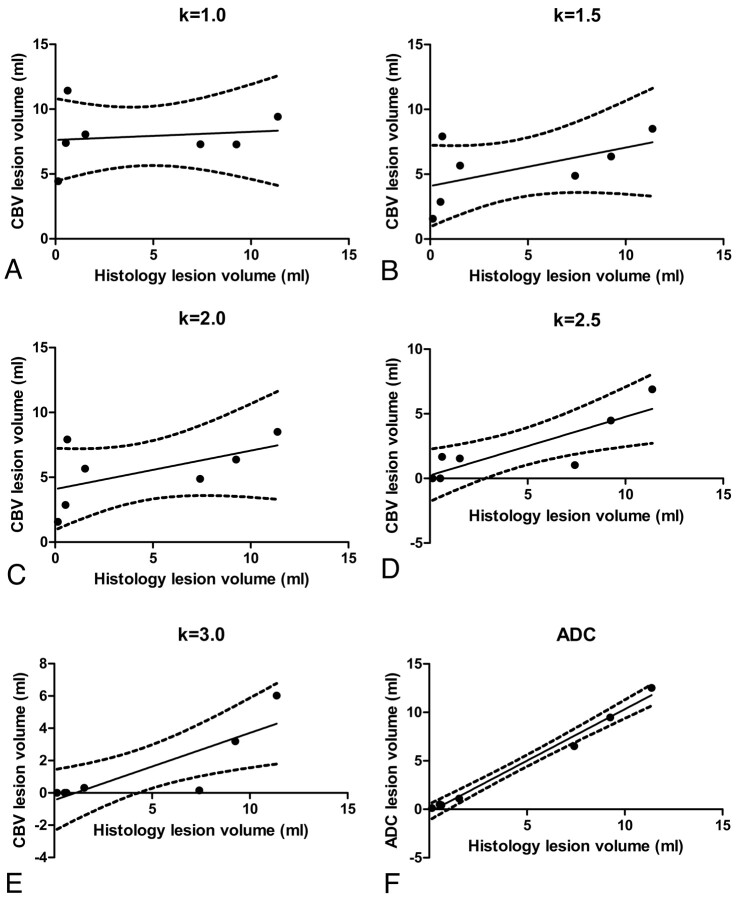
Fig 4.
Linear regression analysis. Lesion volumes in FPD-CBCT−assessed CBV data were measured by using various lesion thresholds with tlesion=CBVh−kσ. A−E, An optimal threshold was established by linear regression analysis of the CBV lesion volumes by using various k-values in relation to lesion volumes obtained with histology. F, The results were compared with the regression analysis of lesion volumes assessed with ADC versus lesion volumes measured with histology. The qualities of the linear fits are summarized in Table 2.

