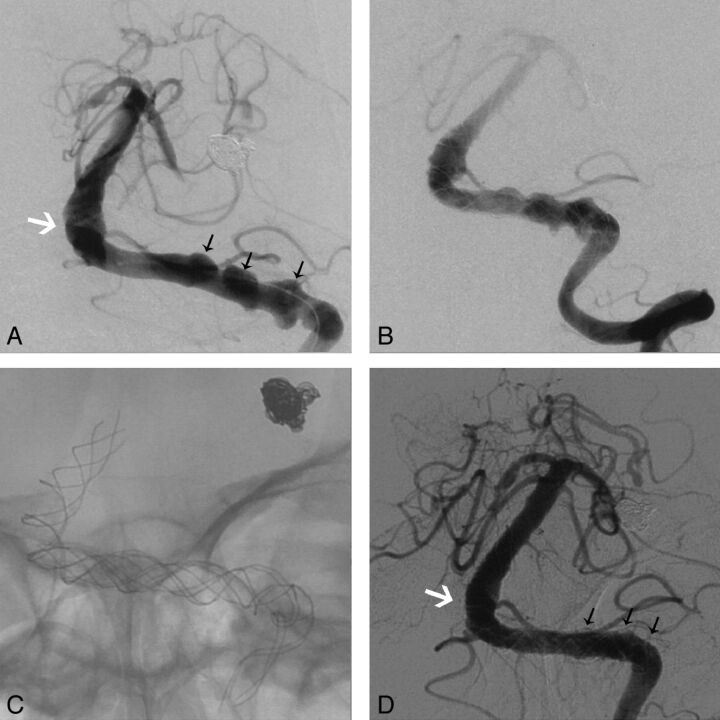
Fig. 2.
A, Anteroposterior position angiogram of the left vertebrobasilar artery depicts the VBD (white arrow) and aneurysmal arterial wall vesicles (black arrows). B, Angiogram immediately after overlapping stent deployment. C, Stents after the procedure. D, Angiographic follow-up 14 months after the procedure shows that the lumen of the basilar artery is thinner than that in A (white arrow) and the vesicles have disappeared (black arrows).

