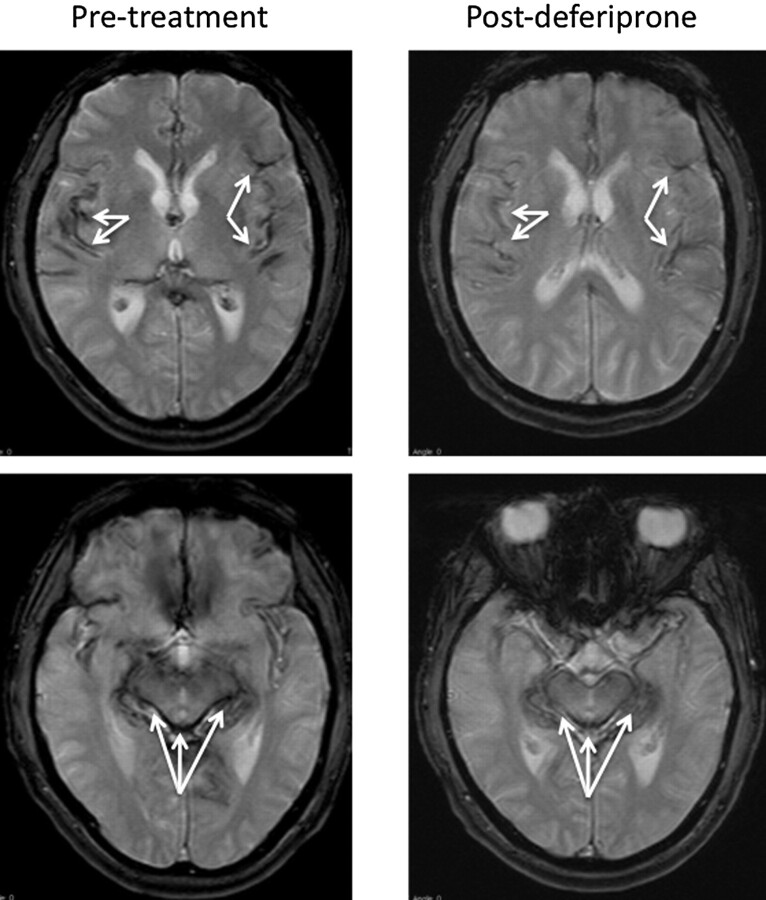
Fig 1.
Axial T2* (TR/TE, 800/26 ms) brain MR images obtained before deferiprone therapy, compared with similarly positioned axial T2* (TR/TE, 560/26 ms) images obtained after deferiprone therapy, show the hypointensities along the pial surfaces representing hemosiderin deposition in the pretreatment cortex, brain stem, and cerebellar vermis. Postdeferiprone, the degree of hypointensity in those same brain areas is decreased; this change indicates reduced hemosiderin deposition. Arrows indicate hypointensity of the iron deposition.

