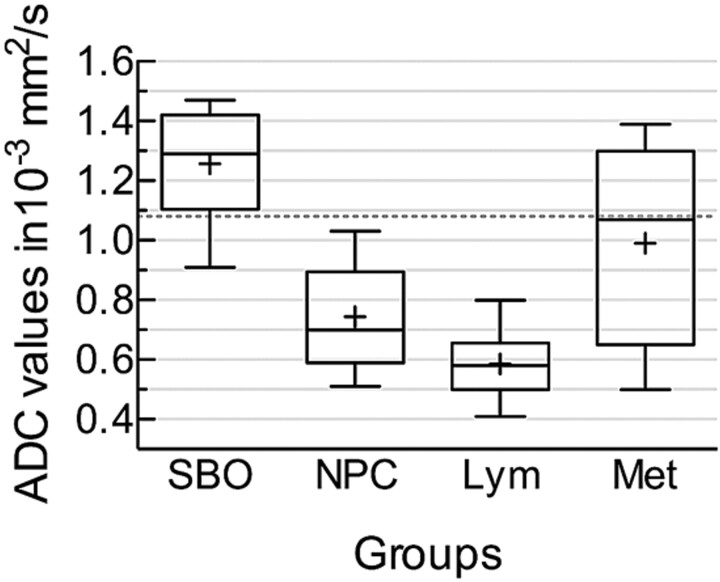
Fig 2.
Box-and-whisker plot comparing the mean ADC values of the affected soft tissues in SBO, NPC, lymphoma, and metastatic lesions. The horizontal line is the median (50th percentile) of the measured values; the top and bottom of the box represent the 25th and 75th percentiles, respectively; and whiskers indicate the range from the largest to the smallest observed data points. The plus sign within the whiskers indicates the mean value for each group. Note that despite the overlap between the ADC values of different groups, the ADCs of SBO are significantly higher than those of lymphoma and NPC. The dotted line represents the cutoff value (1.08 × 10⁻³ mm2/s) distinguishing SBO from NPC and lymphoma.

