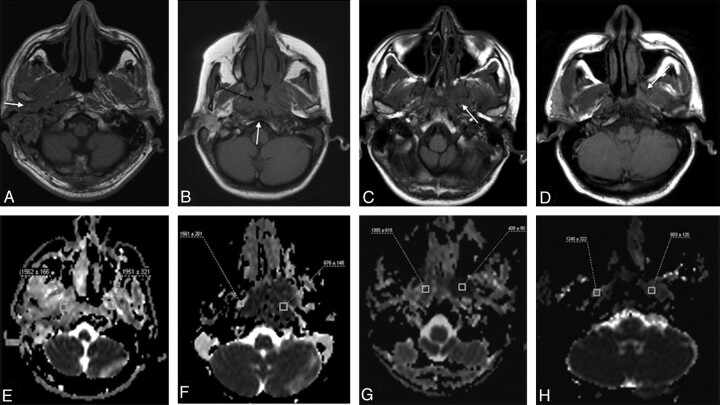
Fig 3.
MR images (anatomic images and ADC maps) of patients from each group. A, Axial T1-weighted image of a patient with SBO demonstrates infiltration of the soft tissues around the EAC, in the retrocondylar fat space (white arrow), extending to the poststyloid parapharyngeal space and jugular foramen (black arrow). B, Axial T1-weighted image of a patient with NPC reveals a large infiltrative mass in the nasopharynx (black arrow) with a small area of clival infiltration (white arrow). C, Axial T1-weighted image of a patient with lymphoma with a low T1-signal-intensity mass around the left pterygoid process (arrow), extending to the masticator space. D, Axial T1-weighted image of a patient with undifferentiated carcinoma metastatic to the skull base with the low T1-signal-intensity metastases on the left (arrow). E−H, Corresponding ADC maps of the patients with SBO, NPC, lymphoma, and metastases, respectively, with the regions of interest placed to measure the ADC values.

