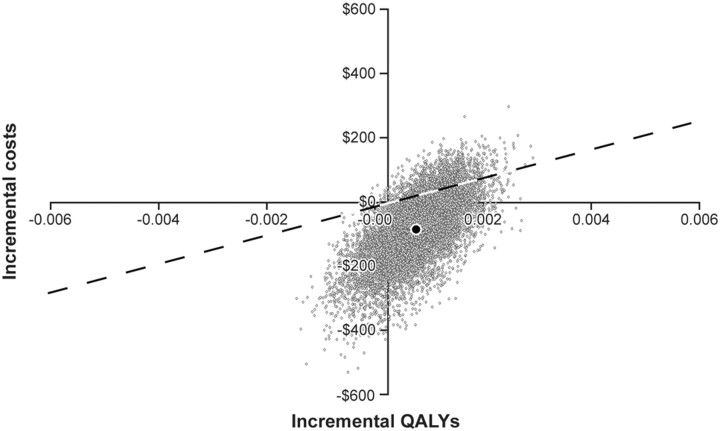
Fig 2.
Results of probabilistic sensitivity analysis: incremental cost-effectiveness scatterplot of patient selection using CTP versus CT for 90 days following primary stroke. Dotted line represents an incremental cost / QALY = $50,000. Points to right of the dotted the line are considered cost-effective. Gray dots represent simulations. The black dot represents the base-case result.

