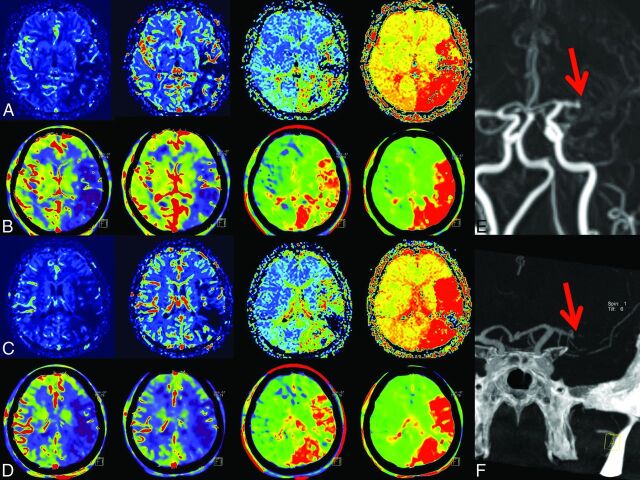
Fig 3.
1) Case example. In rows A and C, MRP; in B and D, FD-CTP parameter maps (left to right: CBF, CBV, MTT, and TTP) are displayed. A and B and C and D are corresponding MRP and FD-CTP images. Due to an MCA occlusion, there is a significant perfusion deficit in all parameter maps. The MCA occlusion was visible in either MRA (E, red arrow) or in FD-CTA (F, red arrow) volume-rendering technique reconstruction.

