
Fig 2.
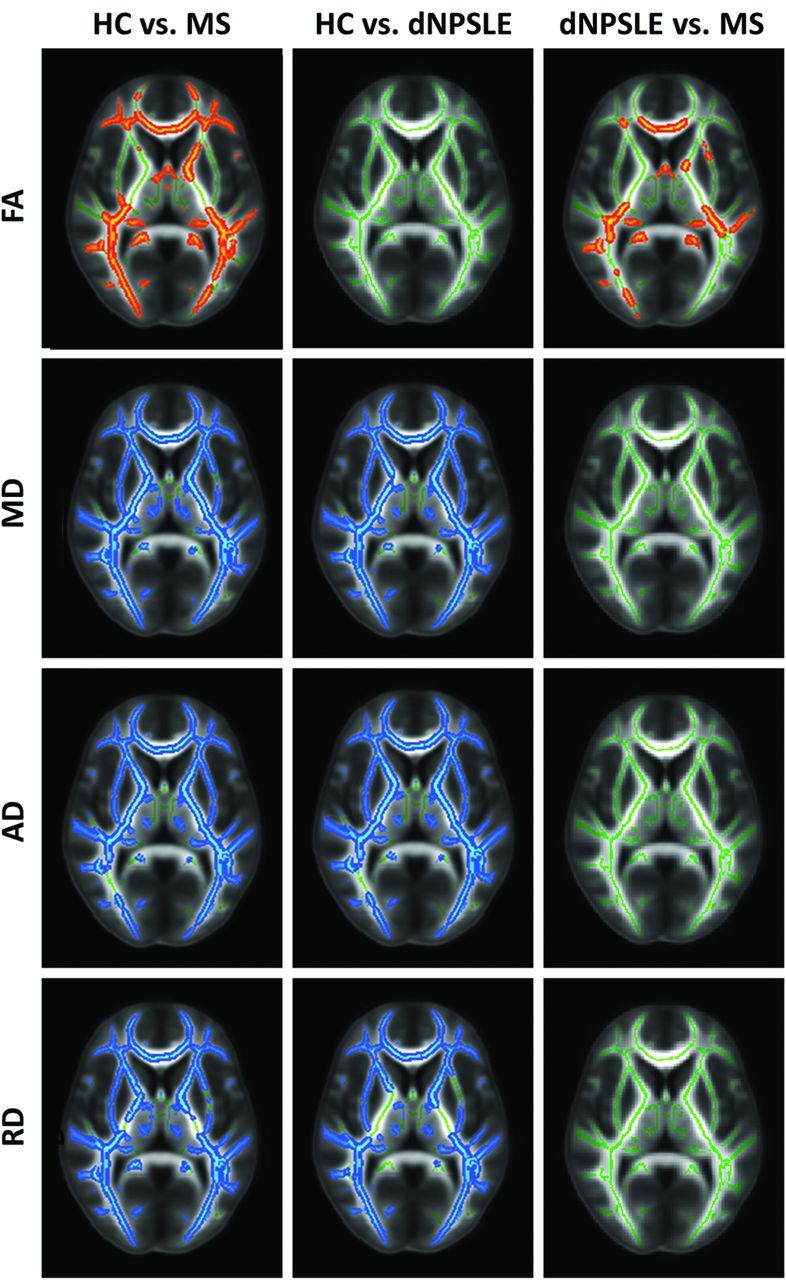
Diffusion tensor imaging TBSS differences among patients with MS, patients with NPSLE with diffuse syndromes, and HCs, controlling for age and sex. The results are shown for FA, MD, RD, and AD differences between the studied groups (P < .05). Red-highlighted areas show where significantly lower FA was found in the second reported group, indicating less anisotropic diffusion. Blue-highlighted areas show significantly increased diffusivity in the second reported group, indicating more diffuse WM damage.