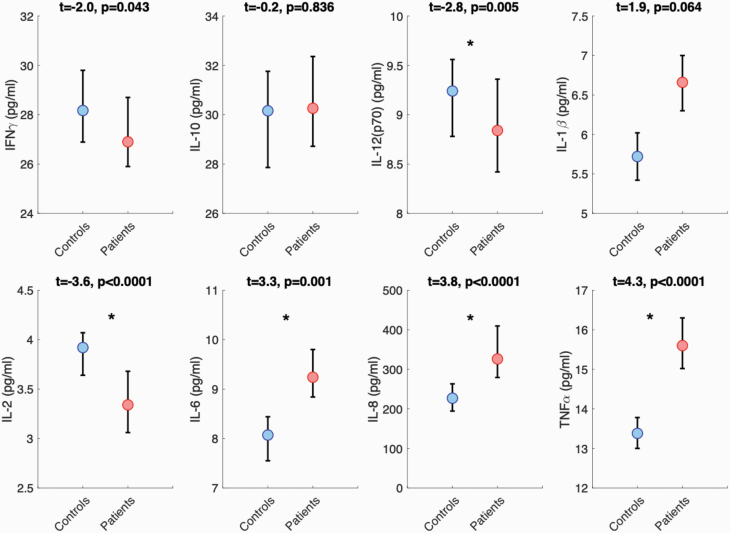
Fig. 1.
Between-group comparisons in serum cytokine levels. Plots display the median and 95% confidence intervals for patients and controls. Asterisks denote significant differences. Analyses corrected for age, sex, and freezer storage time. Refer to supplementary material for statistics after controlling for diagnosis, medication class, and general health conditions.

