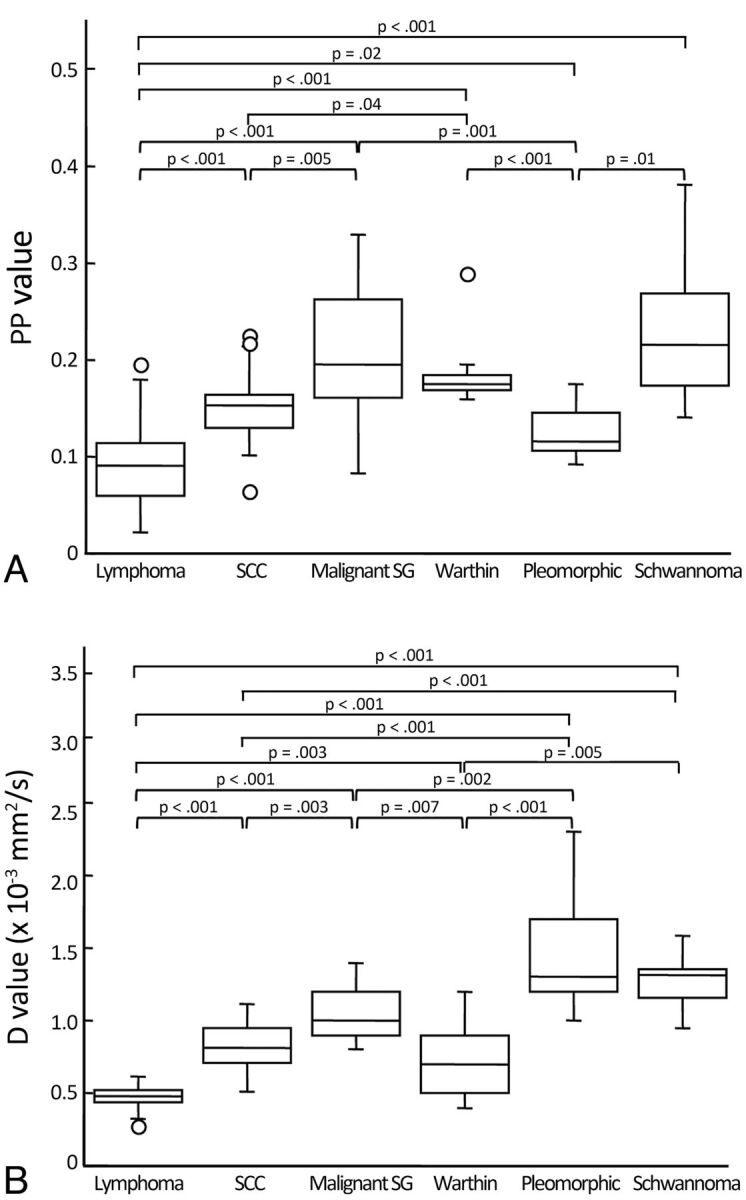
Fig 5.

Boxplots show PP (A) and D (B) values of head and neck tumors. The horizontal line is a median (50th percentile) of the measured values; the top and bottom of the box represent the 25th and 75th percentiles, respectively; and whiskers indicate the range from the largest and smallest observed data within the 1.5 interquartile range presented by the box. P indicates the Steel-Dwass test. Plots demonstrated as open circles indicate outliers. Warthin indicates Warthin tumor; Pleomorphic, pleomorphic adenoma.
