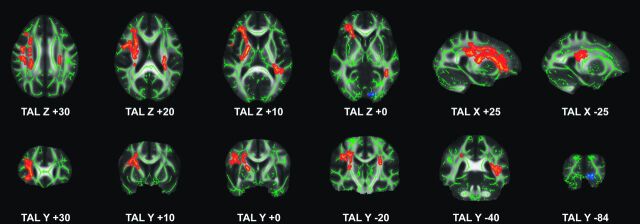
Fig 1.
TBSS analysis between MCI subtypes. md-aMCI compared with sd-aMCI had significantly reduced FA (red to yellow) in a bilateral right-dominant network including right uncinate fasciculus, forceps minor, and internal capsule, as well as bilateral inferior fronto-occipital fasciculus, anterior thalamic radiation, superior longitudinal fasciculus, inferior longitudinal fasciculus, and corticospinal tract. md-aMCI compared with sd-fMCI had less pronounced reduction in FA in right inferior fronto-occipital fasciculus and inferior longitudinal fasciculus (blue to light blue). Axial, sagittal, and coronal sections at the indicated position in Montreal Neurological Institute; standard space coordinates (radiologic convention with right hemisphere on left-hand side). Gray, mean FA value; green, average skeleton. Threshold-free cluster enhancement–corrected for multiple comparisons at P < .05. Suprathreshold voxels were enlarged by using TBSS fill (part of FSL) for illustrative purposes.

