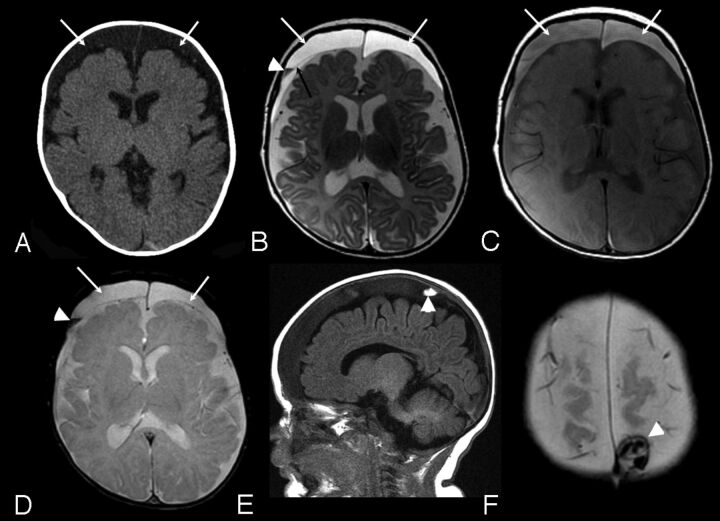
Fig 2.
Case 4. A, Axial CT image. B, Axial FSE T2-weighted image. C, Axial proton density–weighted image. D, Axial gradient recalled-echo image. E, Sagittal T1-weighted image. F, Axial gradient-echo image: 3-month-old boy with macrocrania. Initial CT examination (A) demonstrates moderate sized bilateral subdural collections (arrows), slightly hyperattenuated relative to CSF. MRI examination was performed 14 hours later. Bilateral subdural collections are again identified (white arrows, B, C, and D) hyperintense to CSF on both T2 and proton density–weighted images (B and C). A thin septation is identified on the right (black arrow, B). A layering region of decreased T2 signal is seen on the right (arrowhead, B), which was hyperintense to CSF on T1-weighting (not shown) and blooms on the gradient-echo sequence (arrowhead, D) compatible with blood products. A localized area of increased signal on T1-weighted images in the right parietal vertex subdural collection was noted (arrowhead, E), which was hyperattenuated to brain on CT (not shown) and exhibited blooming on the gradient-echo sequence (arrowhead, F) consistent with additional blood products.

