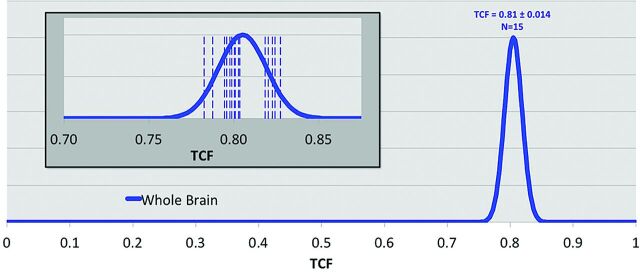
Fig 5.
Distribution of tissue cell fraction measured in brain parenchyma for the whole brain, including gray and white matter (blue, 0.81 ± 0.014) for cognitively healthy individuals (n = 15). The inset shows the individual measurements (vertical dashed lines) of each individual. The SD of the distribution of cell attenuation in healthy subjects is <2% of the total range of possible cell densities.

