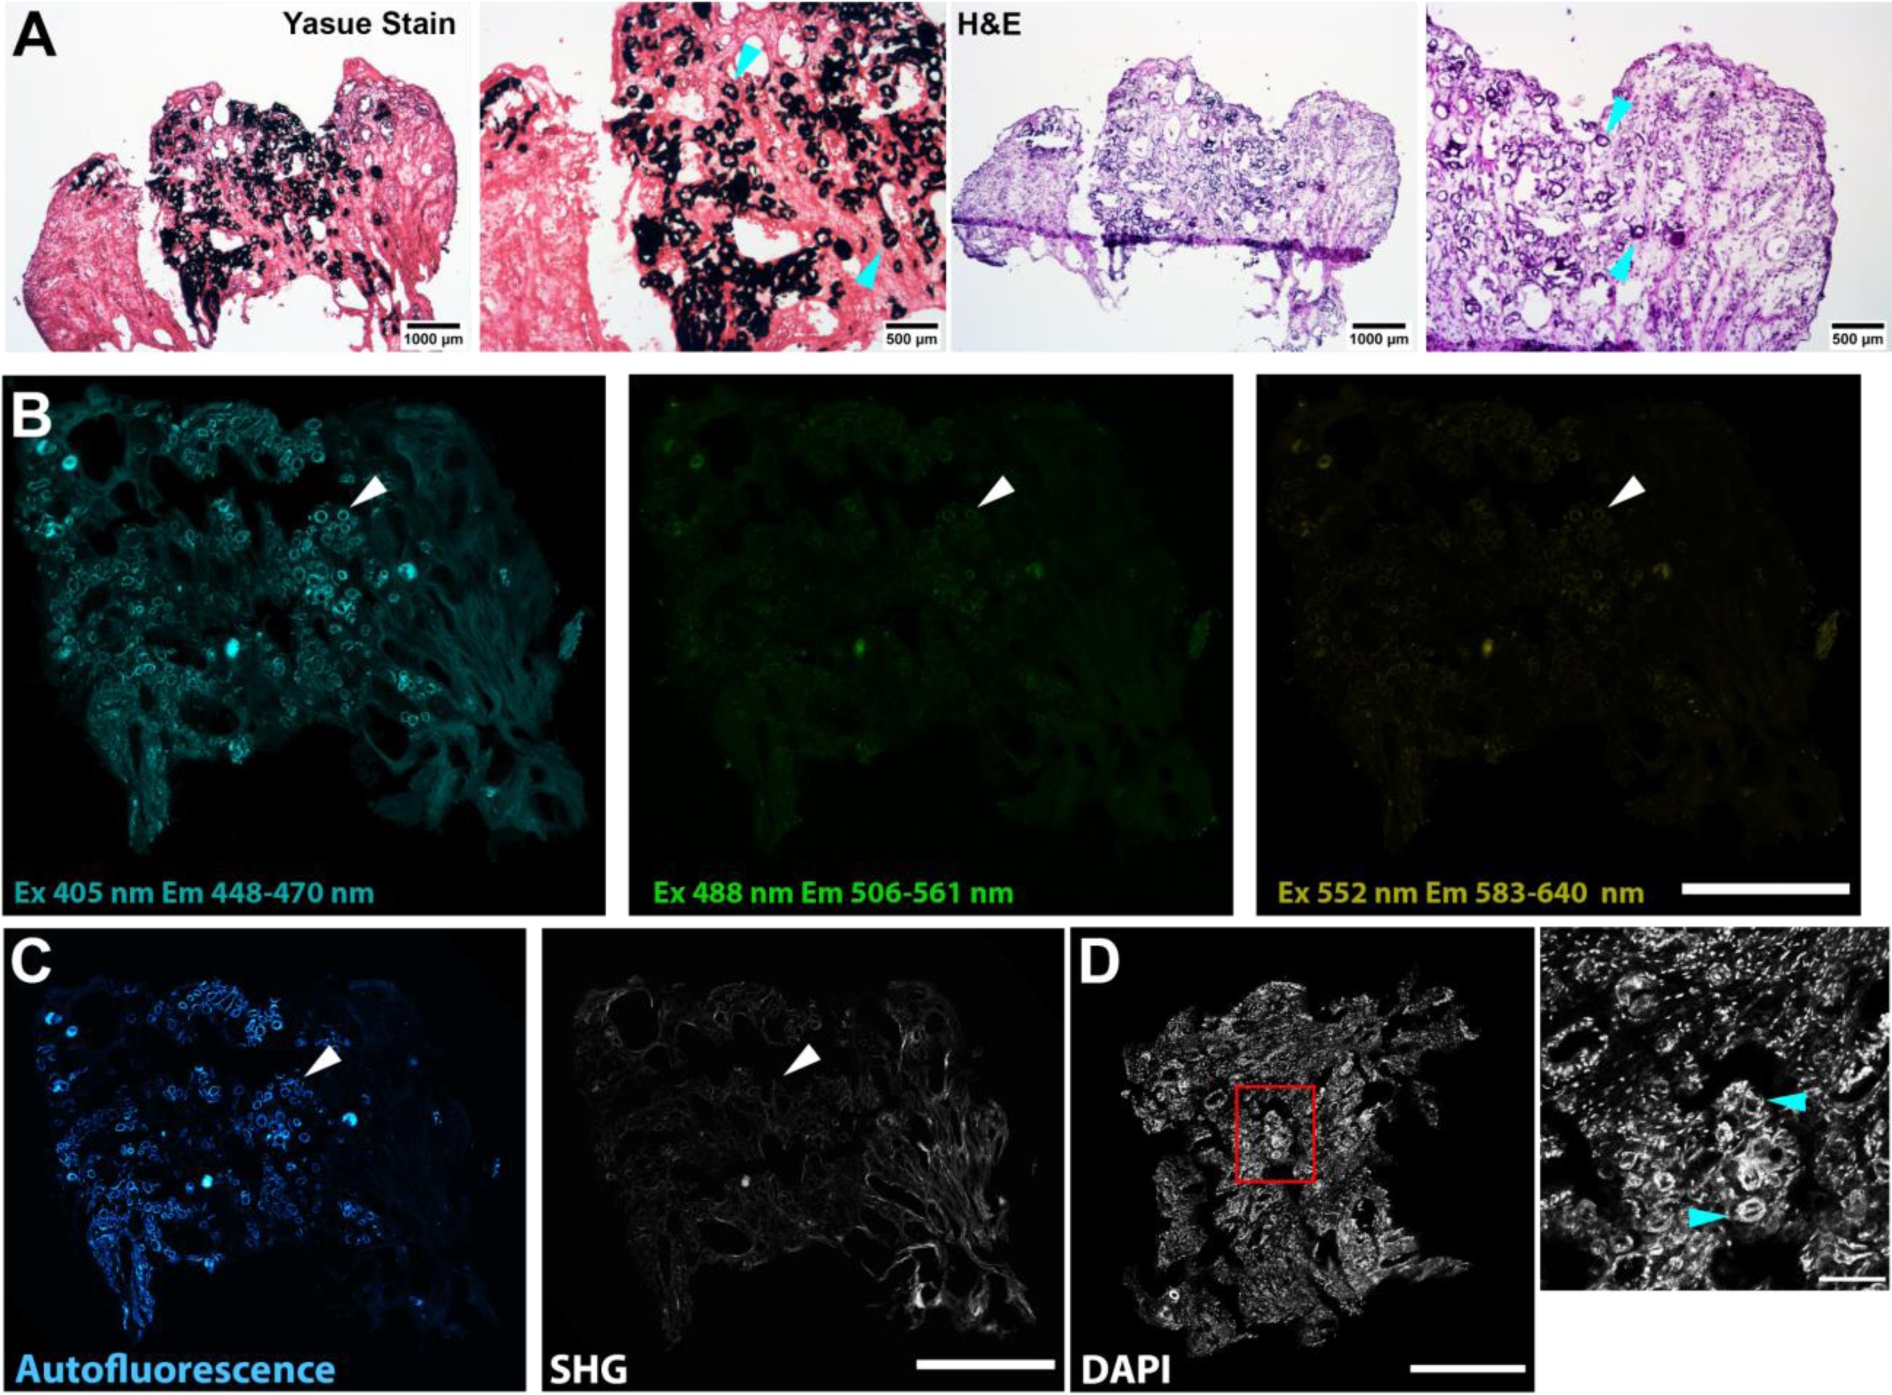
Figure 7. Imaging of Randall’s plaque in papillary biopsy.

Serial sections were stained with Yasue (for mineral) and H&E, or imaged unstained to detect label-free autofluorescence, followed by reimaging after DAPI staining for nuclei. A: Adjacent sections stained with Yasue (left) and H&E (right). Cyan arrowheads indicate silver precipitation by Yasue staining or basophilic staining by H&E. Scale bars as indicated. B: Label-free autofluorescence imaging of unstained adjacent section with confocal fluorescence microscopy, excitation (Ex) and emission (Em) as indicated. Scale bar = 500 μm. C: Label-free autofluorescence imaging on unstained adjacent section with illumination at 910 nm and emission at 448–470 nm (left) and collection at 400–450 nm (right). Left shows distinct autofluorescence that correlates with Randall’s plaque mineral shown in A (arrowhead). Right shows second harmonic generation (SHG) which indicates the presence of fibrillar collagen. Scale bar = 500 μm. D: Following staining with DAPI, both nuclei and plaque autofluorescence are visible. Randall’s plaque appears as bright rings (arrowheads) fluorescing in the same range as the DAPI-stained nuclei. Left shows low-power with red box indicating field shown on right. Scale bar = 500 (left) and 100 (right) μm.
