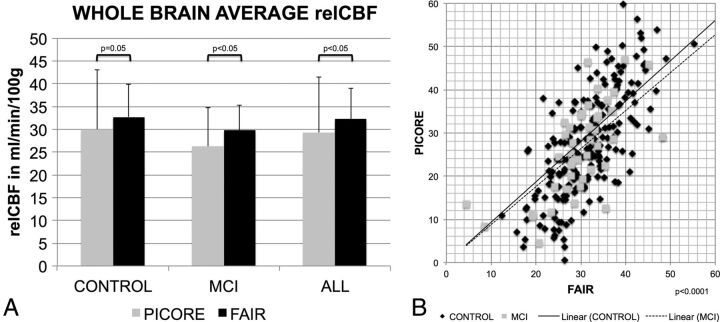
Fig 1.
A, The whole-brain average rCBF (relCBF) values in milliliters/minute/100 g for the 2 ASL sequences, PICORE and FAIR, only for elderly control participants (CONTROL), only for MCI, and for ALL participants. FAIR provided significantly higher signal than PICORE (P < .05). The error bars indicate SD. B, The correlation of the whole-brain average rCBF between PICORE and FAIR was significant at P < .0001. The lines represent the linear fit for CONTROL and MCI with an intercept of zero.

