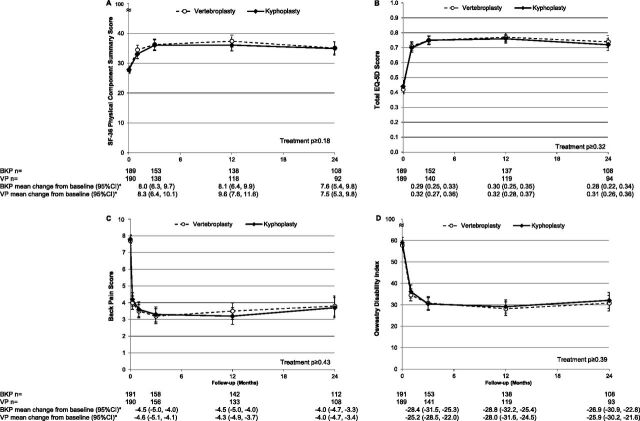
Fig 4.
Quality-of-life, disability, and pain assessments at baseline and after balloon kyphoplasty or vertebroplasty. Means and 95% confidence intervals are shown for balloon kyphoplasty (solid lines) and vertebroplasty (dashed lines) for the SF-36 Physical Component Summary (scale 0–100) (A); the total EQ-5D scores (scale 0–1) (B); back pain (scale 0–10) (C); and the Oswestry Disability Index (scale 0–100) (D). The treatment P value in each panel indicates the comparison between groups. Below each panel, the n for each group is shown for baseline, 3, 12, and 24 months and the group average for change from baseline and 95% CI for 3, 12, and 24 months. The asterisk indicates P < .001 for all change from baseline scores.

