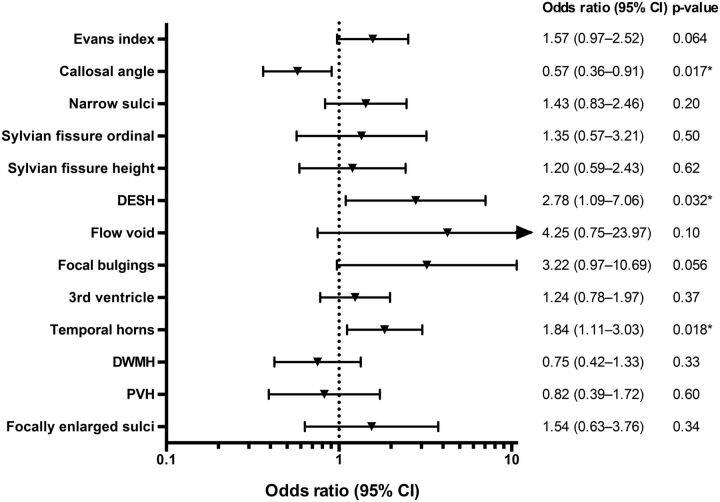
Fig 4.
Forest plot with sex-adjusted odds ratios for all imaging features. OR with a 95% CI of 1-SD increase for continuous variables and a 1-U increase for dichotomous and ordinal variables. An arrow indicates that the confidence interval extends beyond the range of the plot. The Sylvian fissure ordinal is the ordinal scale 0–2; the Sylvian fissure height is measured in millimeters. The asterisk indicates P < .05.

