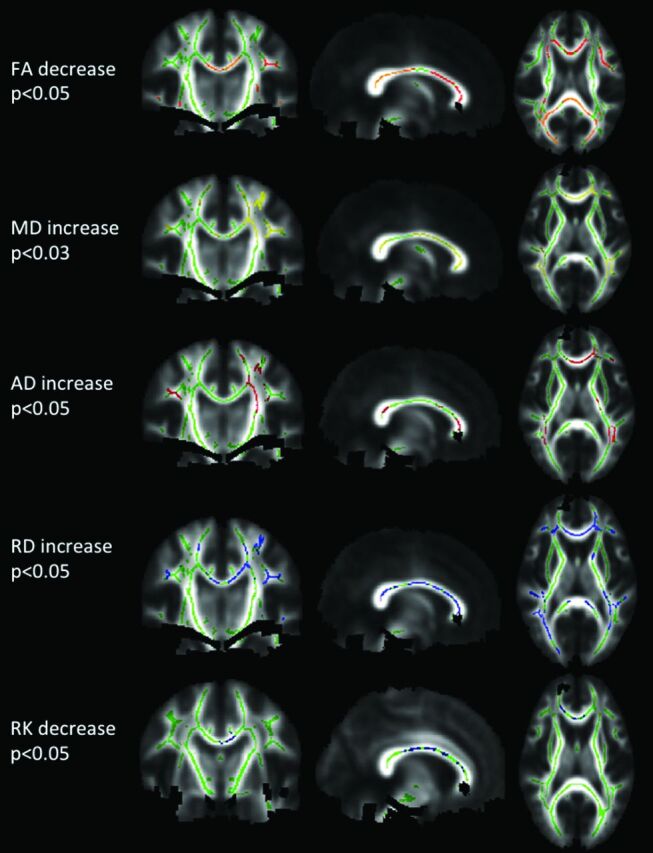
Fig 2.

TBSS analysis. Significance P maps, corrected for multiple comparison, for DTI and DKI parameters are overlaid color-coded on the skeleton and mean FA image. In green, the mean FA skeleton, where statistical analysis was performed. The following areas are significantly reduced in patients with NMO compared with controls: FA (red-yellow) and RK (blue), or significantly higher, MD (yellow), AD (red), RD (blue).
