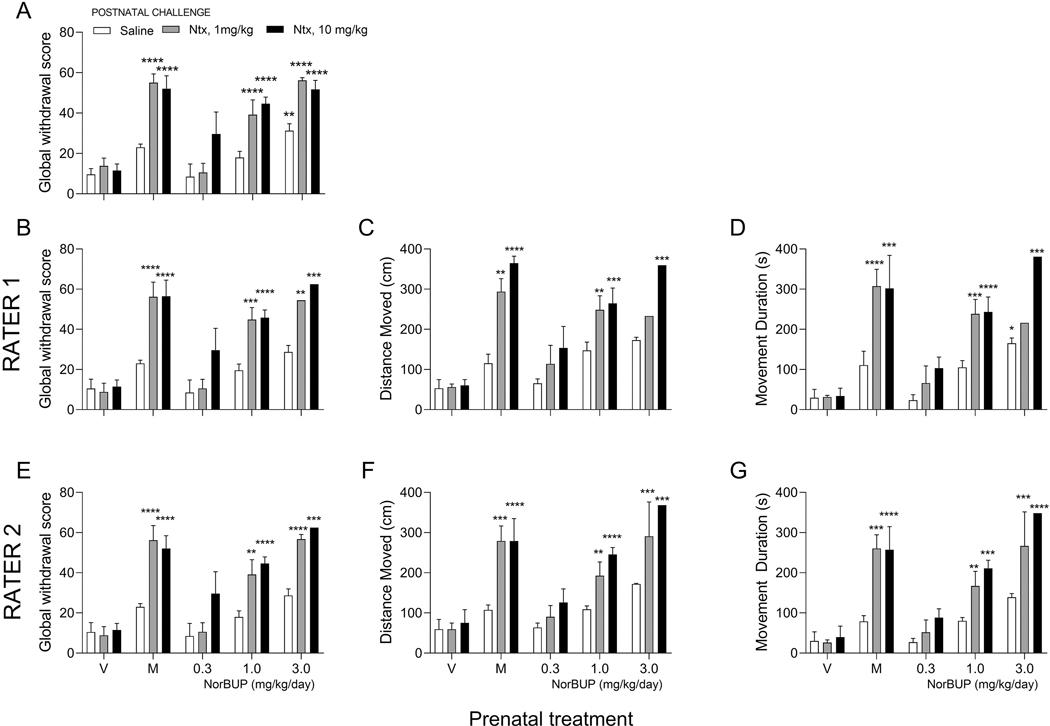
Figure 6. Manual grading and automated quantification methods closely agree in analyses of group means.
Panels represent analyses performed using GWS (A, B, E), Distance Moved (C, F), and Movement Duration (D, G) as endpoints. Scores for these endpoints are plotted on the y-axes, and prenatal treatment with vehicle (V), morphine (M, 15 mg/kg/day), or NorBUP (0.3, 1.0, or 3.0 mg/kg/day) is plotted on the x-axis. Figure (A) represents global withdrawal scores of all pups (previous published and used here with permission from the Journal of Pharmacology and Experiment Therapeutics), while Figures (B) and (E) include only pups that were also included in the Ethovision® XT analyses by Raters 1 and 2, respectively. Bars and error bars represent treatment group means and standard errors, respectively, following challenge with saline (open bars), 1 mg/kg naltrexone (gray bars), or 10 mg/kg naltrexone (filled bars). Asterisks indicate statistically significant difference versus control group (vehicle-treated, saline-challenged) at the following levels: *p < .05, **p < .01, ***p < 0.001, ****p < 0.0001.

