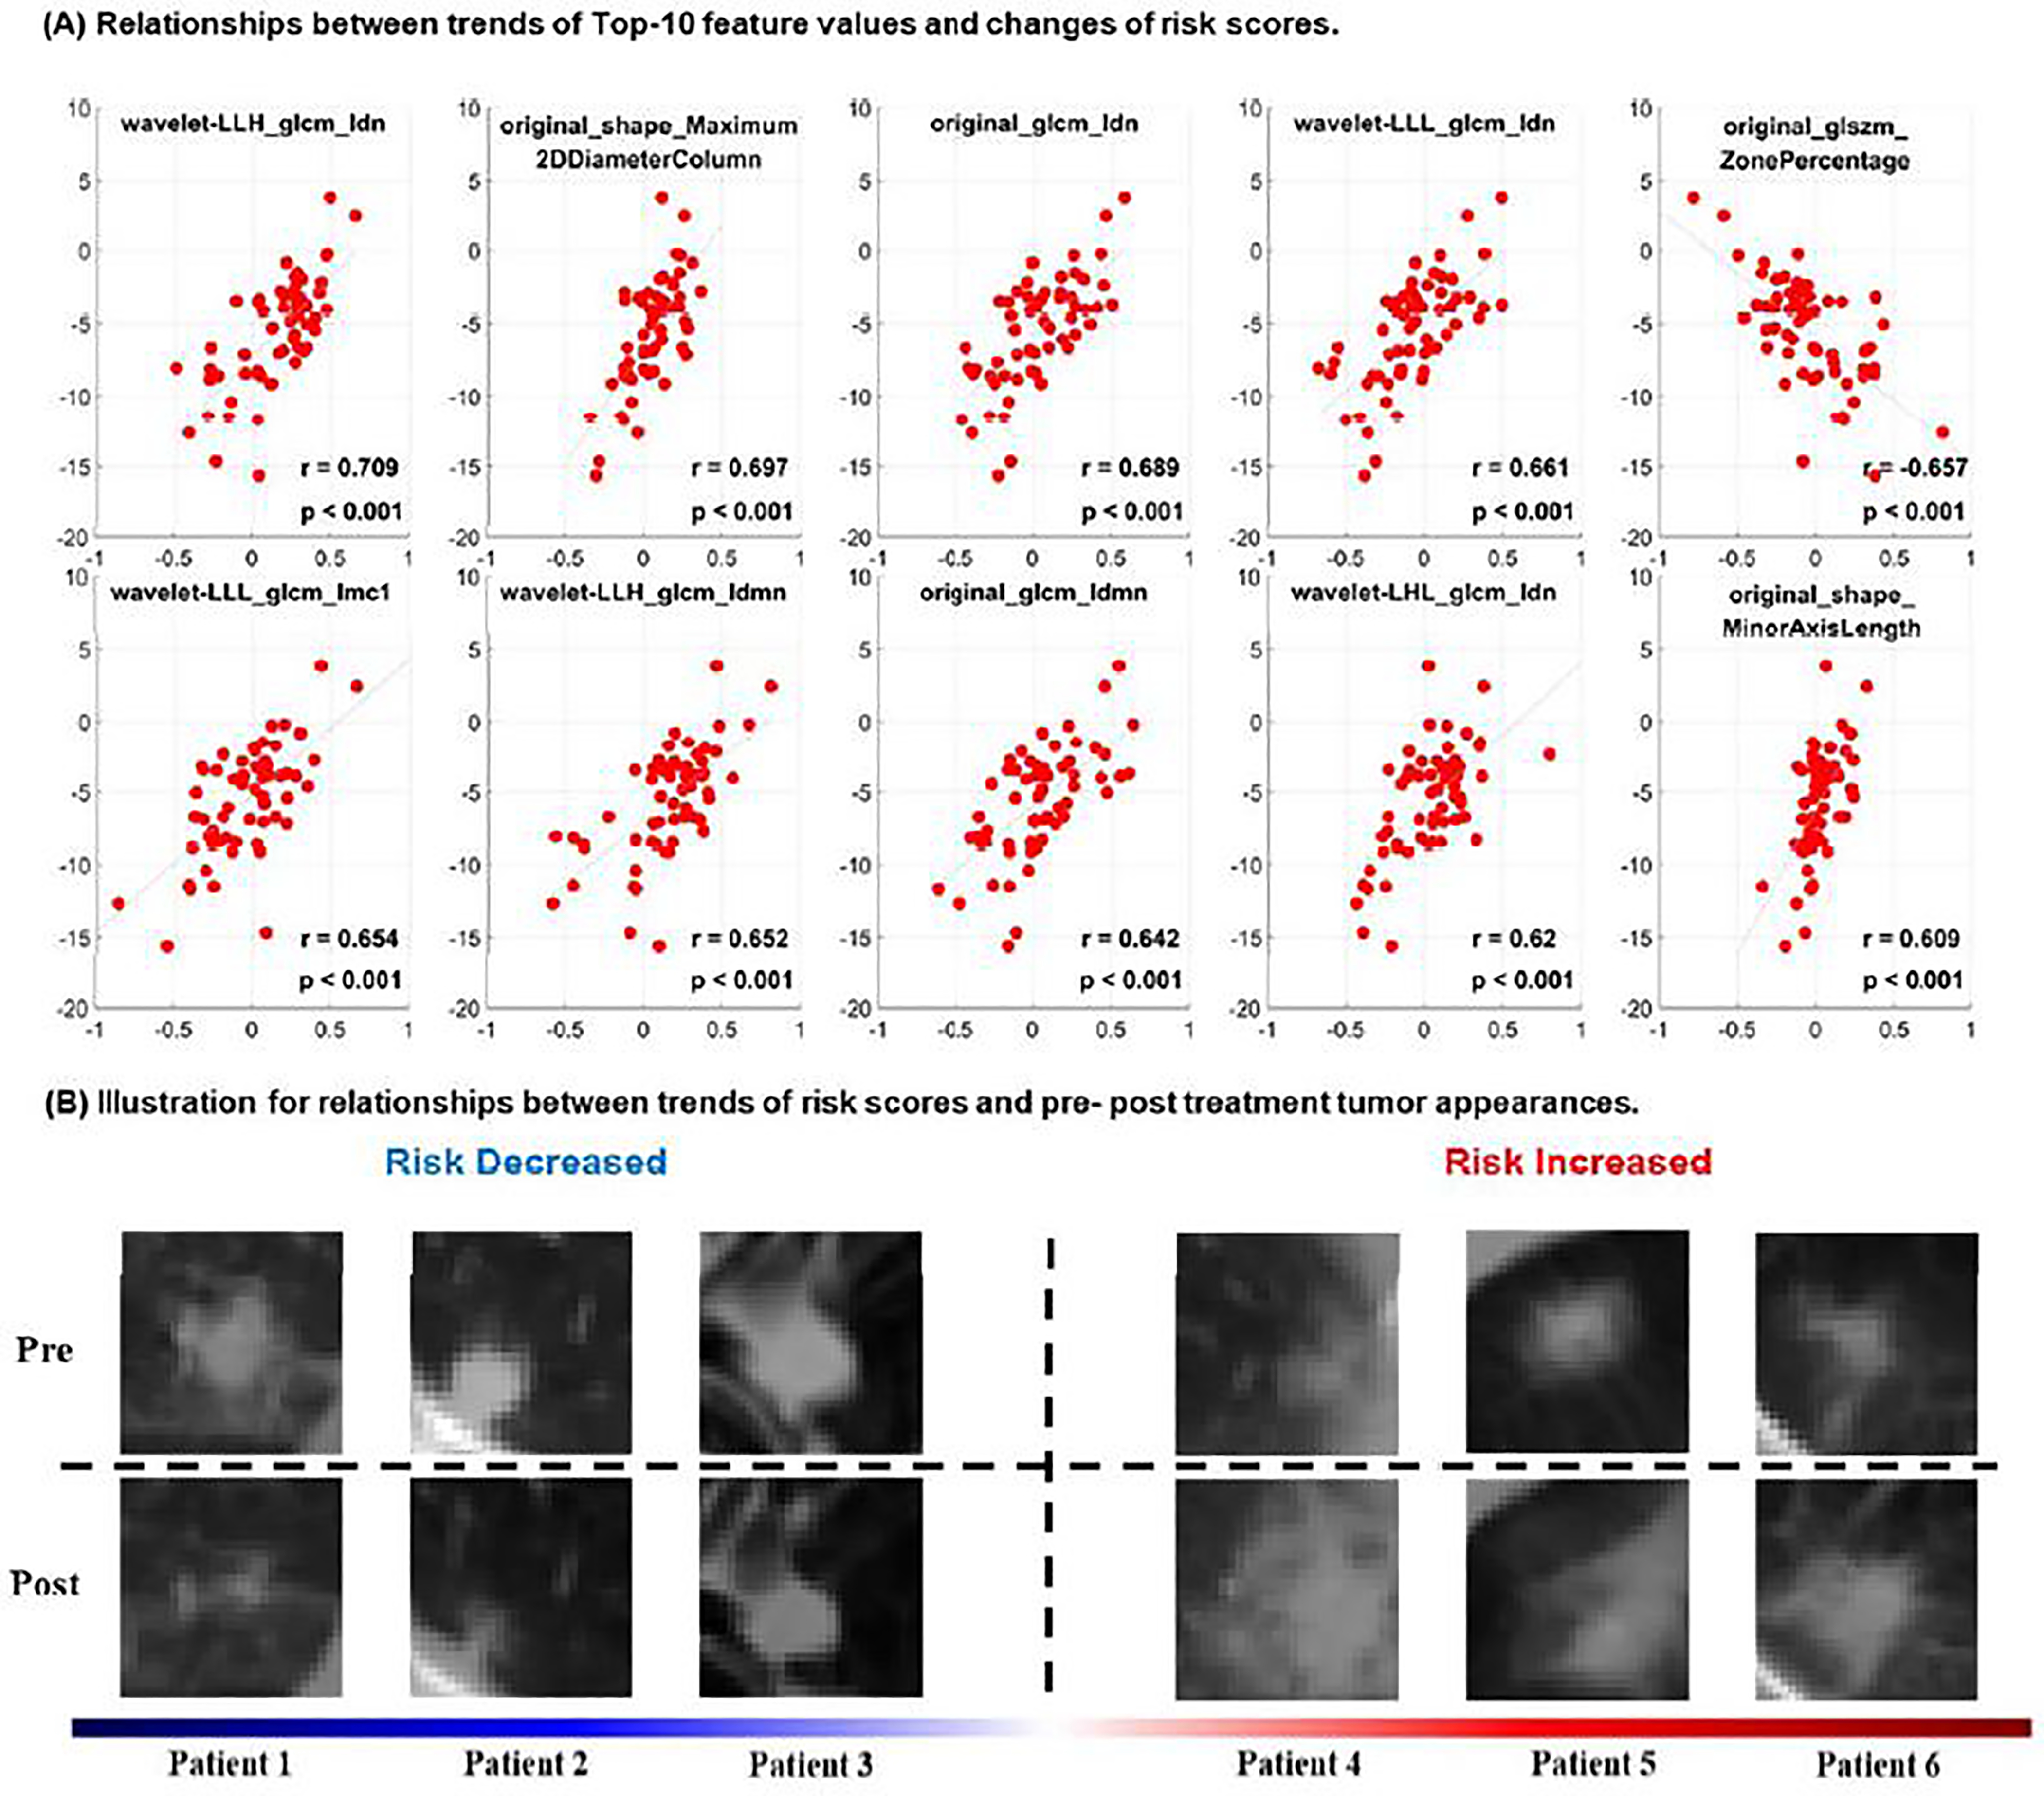
Figure 4.

Quantitative correlation analysis of changes in radiomic features with change in risk scores and visual inspection of changes in tumor images before and after SBRT. (A) Relationships between trends of Top-10 feature values and changes of risk scores estimated from pre- and post-treatment CT scans. (B) pre-treatment (top row) and post-treatment (bottom row) tumor CT scans of representative patients with increased or decreased risk scores after SBRT treatment.
