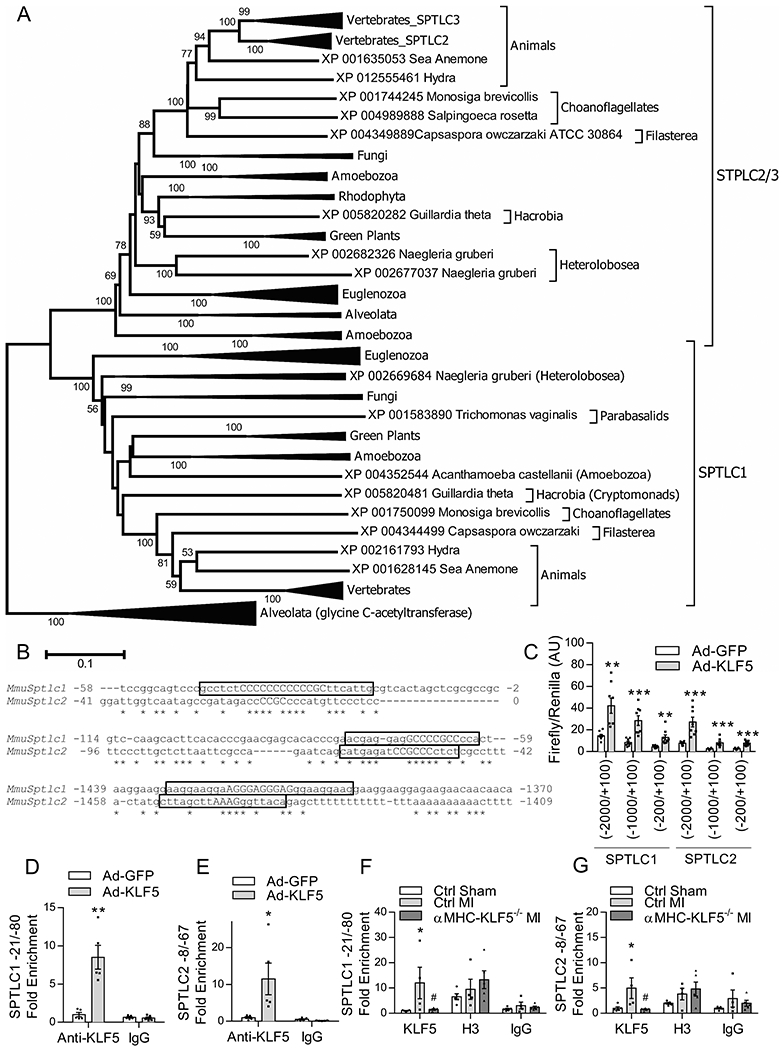
Figure 6: KLF5 Directly Activates the SPTLC1 and SPTLC2 on Conserved Promoter Elements.

Phylogenetic tree showing the evolutionary relationships of the Sptlc1 and Sptlc2 genes (A). Alignment of promoter regions of the mouse Sptlc1 and Sptlc2 containing predicted KLF5 binding sites highlighted in yellow with the anchor sequences in capital letters (B). Firefly luminescence of luciferase reporter gene driven by Sptlc1 and Sptlc2 promoter fragments normalized to renilla control luminescence in AC16 cells transfected with luciferse promoter plasmids containing truncations of the mouse Sptlc1 and Sptlc2 promoters and infected with Ad-GFP and Ad-KLF5 (C). n=8 wells/condition. **p<0.01, ***p<0.001 versus respective Ad-GFP infected well by t-test. KLF5 enrichment normalized to input for the −21/−80 KLF site of the Sptlc1 promoter and −8/−67 KLF site of the Sptlc2 promoter of HL1 cells infected with Ad-GFP or Ad-KLF5 evaluated by ChIP qPCR (D, E). n=5 wells/group *p<0.05, **p<0.01 versus Ad-GFP by t-test. KLF5 enrichment normalized to input for the −21/−80 KLF site of the Sptlc1 promoter and −8/−67 KLF site of the Sptlc2 promoter evaluated by ChIP qPCR in heart tissue from control mice following sham or MI surgery, and from αMHC-KLF5−/− mice following MI surgery (F, G). n=5 Ctrl sham, n=4 Ctrl MI, n=5 αMHC-KLF5−/− MI hearts. *p<0.05 vs Ctrl sham by Two-way ANOVA with Tukey HSD.
