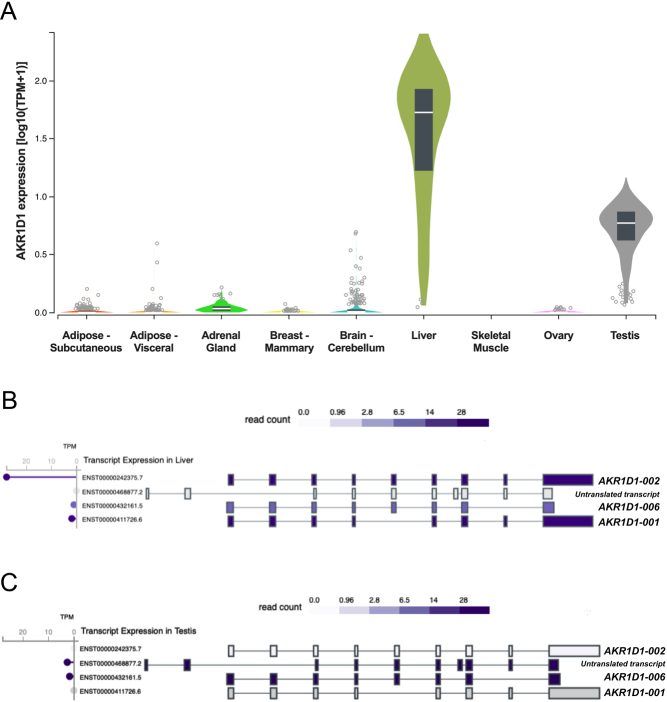
Figure 2.
(A) AKR1D1 transcript levels in human adipose, adrenal gland, breast, brain, liver, skeletal muscle, ovary and testicular tissues.$ (B) Transcript expression levels of AKR1D1 splice variants in human liver.$ (C) Transcript expression levels of AKR1D1 splice variants in human testes.$ $Data extracted from https://www.gtexportal.org (GTEx). GTEx-extracted expression values are shown as transcripts per million (TPM). Box plots are shown as median and 25th and 75th percentiles. Points displayed are outliers 1.5 times above or below the interquartile range.

 This work is licensed under a