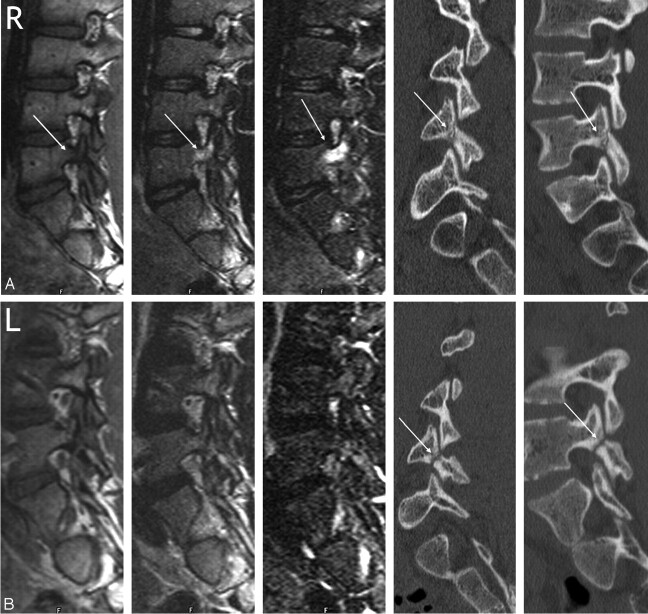
Fig 2.
Type 1 pedicle marrow signal intensity changes associated with an early to progressive pars fracture and absence of signal intensity changes in a terminal spondylolysis in an 18-year-old man with back pain and bilateral spondylolysis. Right (A) and left (B) parasagittal MR images of the lumbar spine. In each figure, the T1, T2, STIR, and multiplanar reformatted oblique and parasagittal CT images are shown, from left to right. A, Hypointensity of the L4 right pedicle is evident on T1 with increased signal intensity on T2- and STIR-weighted images (arrows). A relatively acute fracture is noted through the pars interarticularis on the CT images (arrow). B, Signal intensity of the left pedicle is normal on all sequences. The CT images reveal an older pars fracture (arrows).

