
Fig 2.
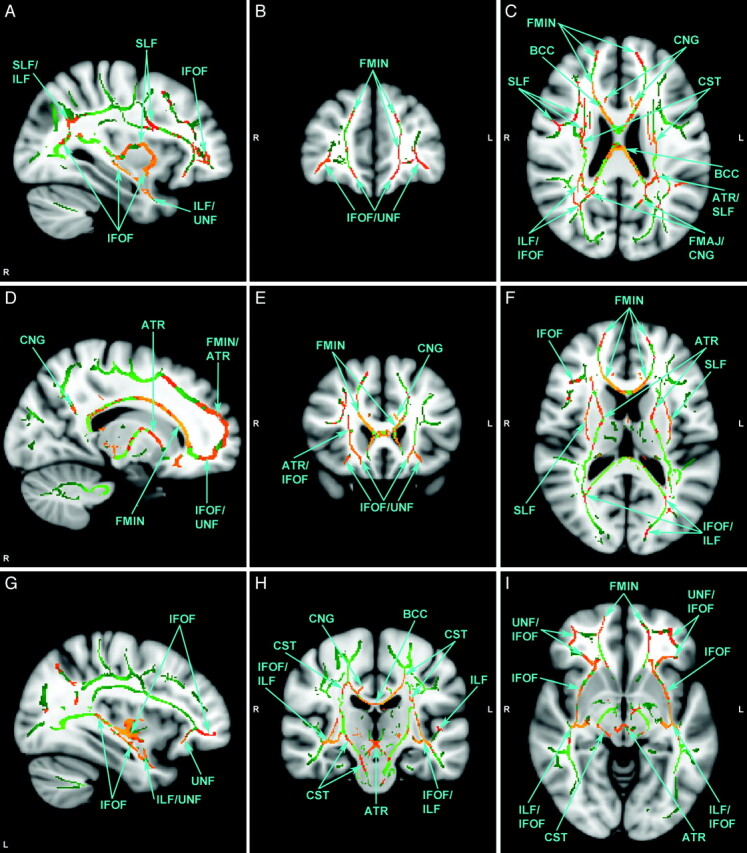
Selected views of affected fiber tracts with reduced FA, illustrated on MNI template brain. Identified in green are those voxels in the group-wise comparison where FA is not significantly different. Identified in red-orange are those voxels where FA is significantly lower in the autism group. Orange indicates higher statistical significance. There are no voxels where FA is significantly higher in the autism group. MNI coordinates for each view are as follows: x=57 (A), y=167 (B), z=95 (C), x=73 (D), y=149 (E), z=86 (F), x=124 (G), y=106 (H), and z=66 (I). L=left; R=right.