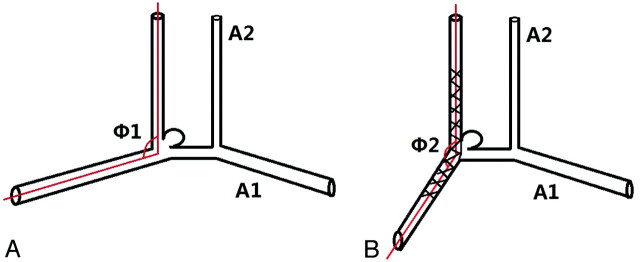
Fig 1.
Schematic drawing showing the measurements obtained: the angles Φ1 and Φ2 formed between the A1 segment and A2 segment, before (A) and after (B) stent placement. The angle Φ was initially marked by lines. A dot was marked on the middle of aneurysmal neck. Then, 2 lines parallel to inflow tract and outflow tract were marked. The angle Φ was measured for 2 intersecting lines. The angle change between Φ1 and Φ2 was calculated.

