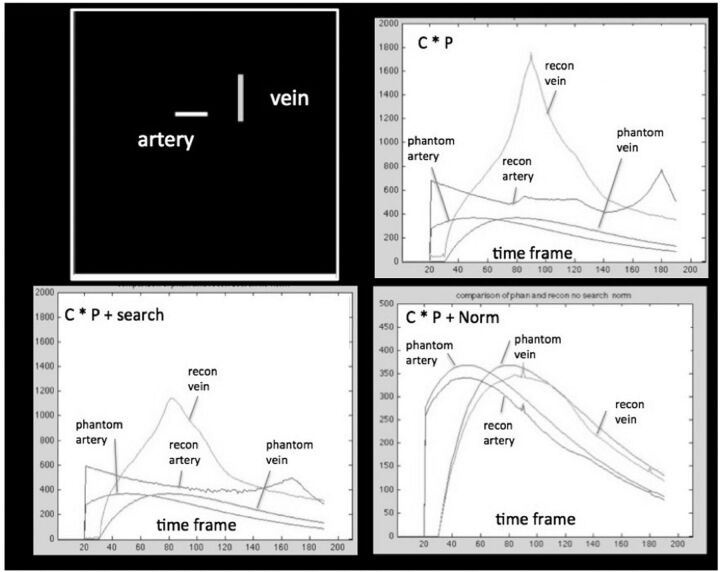
Fig 3.
Demonstration of the effects of reconstruction elements on accuracy of reconstructed simulated vessel signal curves. The digital phantom is shown in the top frame on the left. The vessels in the phantom (phantom artery and phantom vein) had specified time dependence. These are considered to represent ground truth. The input time curves for these vessels are shown in each panel for comparison. C indicates constraining image; P, projections. The reconstructed wave forms are shown: 1) after multiplication (represented by C × P) of the projections by a binary constraining image (top right); 2) multiplication of the projections by the binary constraining image plus an angular minimum search (represented by C × P + search, bottom left); and 3) multiplication of the projections by the binary constraining image followed by normalization by the estimate of the numbers of projected ray voxels obtained from the constraining image (C × P + Norm, bottom right). The y-axis shows arbitrary units of attenuation. The x-axis shows the projection number.

