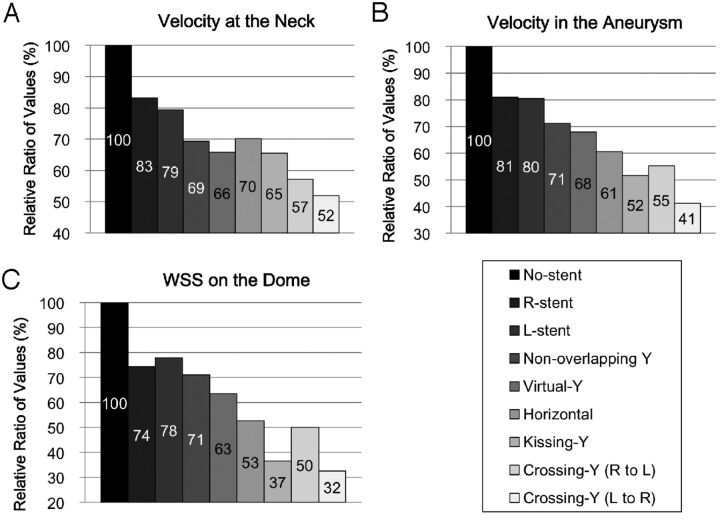
Fig 6.
Relative ratios of area-averaged velocity at the neck orifice (A), volume-averaged velocity in the aneurysm (B), and area-averaged WSS on the dome (C), shown as cycle averages for the 9 models. Most of the reduction in velocity or WSS was observed in the kissing-Y, crossing-Y (R to L), and crossing-Y (L to R) models.

