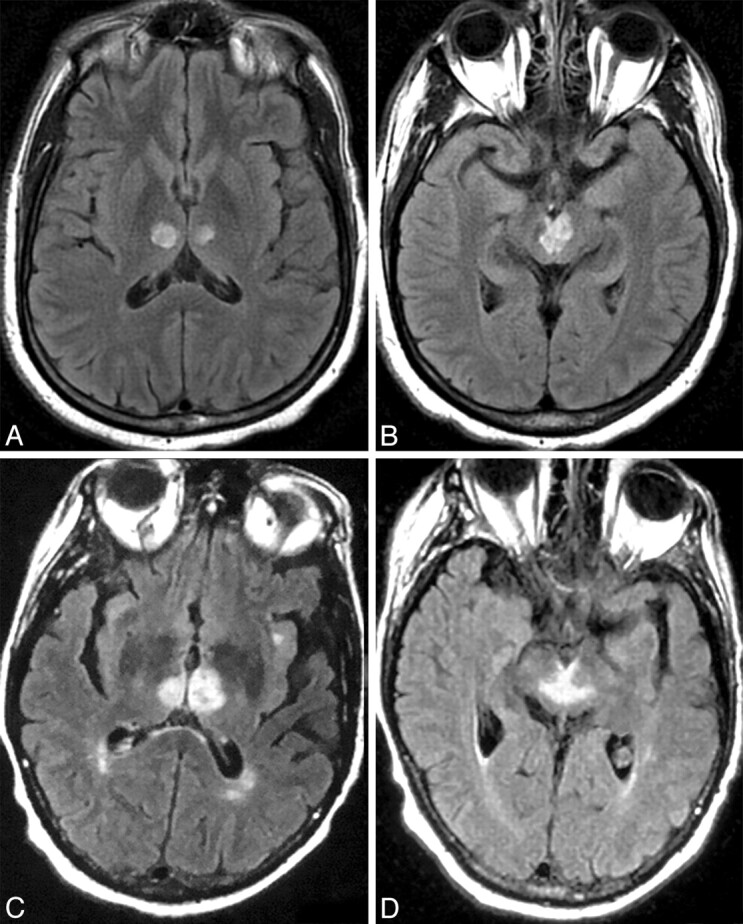
Fig 3.

Case 2 (A and B) and case 16 (C and D). Axial FLAIR MR images at the level the thalamus (A and C) and midbrain (B and D) demonstrate bilateral paramedian thalamic and midbrain involvement (pattern 1). Notice the hyperintense signal intensity along the pial surface of the midbrain interpeduncular fossa representing the V sign (B and D).
