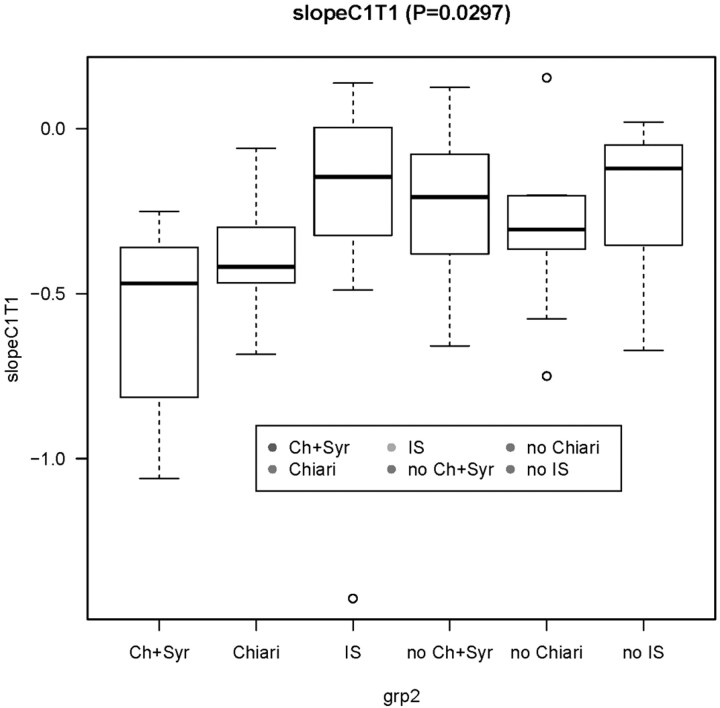
Fig 3.
Box-and-whisker display of taper ratios for the 3 patients and 3 control groups. The midline denotes the median, the box spans the middle 50% of the data (IQR), and the whiskers extend to the most extreme observation within 1.5 times the IQR; observations outside this range are displayed individually. The P value in the title is from a Kruskal-Wallis test.

