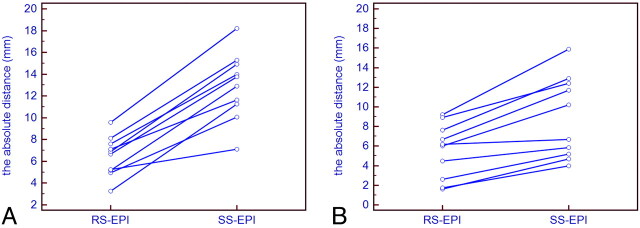
Fig 2.
A, Distortion measurements at the level of the temporal base. B, Distortion measurements at the level of the cerebellum. The absolute distances between the contours of the temporal base (A) and the cerebellum (B), visible on the diffusion trace images for RS-EPI and SS-EPI and the corresponding T2-weighted images, are shown. The amount of distortion is significantly reduced with RS-EPI compared with SS-EPI (P <.01).

