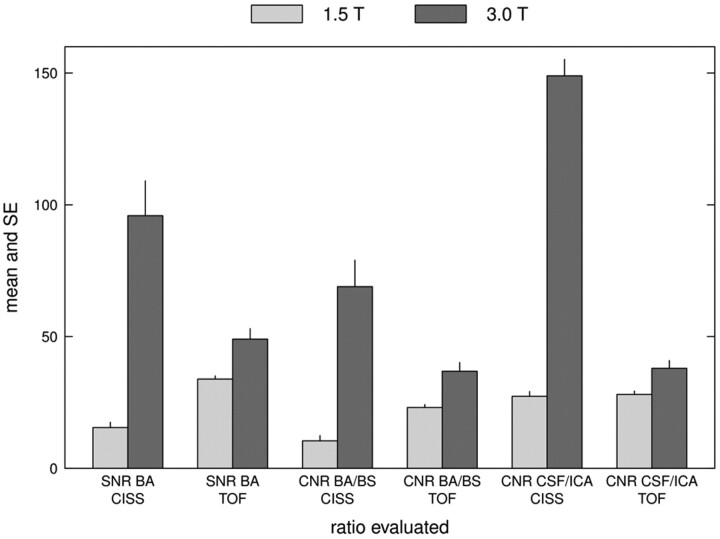
Fig 5.
Bar graph showing the mean (± standard error) of the SNR of the basilar artery, CNR between the basilar artery and brain stem, and CNR between the CSF and ICA for both the 3D-CISS and 3D-TOF MRA. Note the higher SNR and CNR for all items at 3T, though they are more pronounced for the 3D-CISS than for the 3D-TOF MRA.

