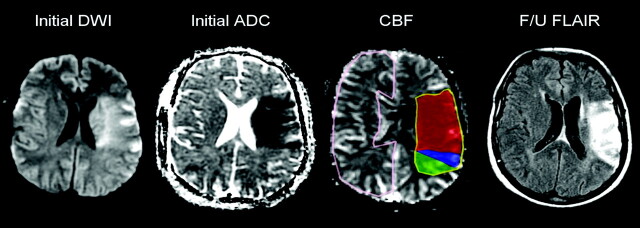
Fig 1.
Acute left MCA infarction. Ischemic tissue divided into 3 regions: 1) C (red) with DWI hyperintensity, CBF hypointensity, follow-up infarction; 2) PI (blue) with normal DWI, CBF hypointensity, follow-up infarction; 3) PNI (green) with CBF hypointensity, but normal DWI and follow-up images. Normal tissue in the contralateral hemisphere (pink) was outlined to provide normalization.

