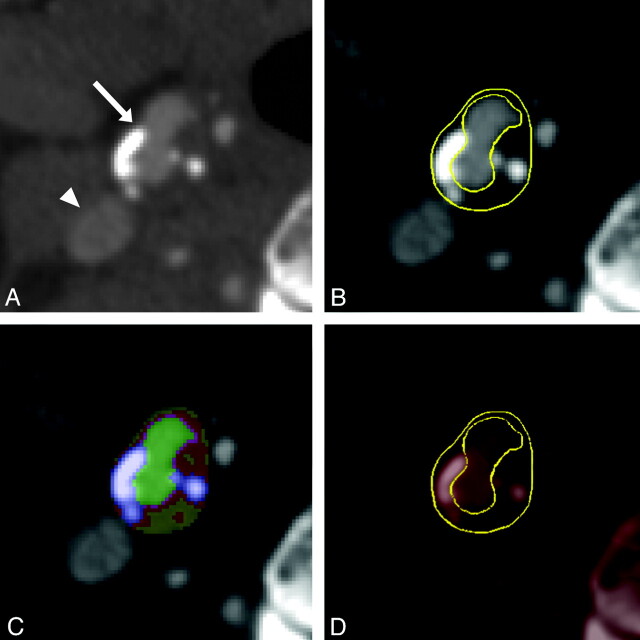
Fig 1.
MDCT (A−C) and fused 18F-FDG PET/MDCT (D) images of a transverse section of plaque at the carotid bifurcation. The arrow indicates the bifurcation with plaque, while the arrowhead indicates the internal jugular vein (A). Regions of interest encompassing the plaque and arterial lumen have been drawn on the MDCT image (B), from which a pixel map based on differences in Hounsfield units was obtained (green indicates arterial lumen; yellow, lipids; red, fibrous tissue; blue/white, calcifications) (C). Regions of interest were transferred onto the fused 18F-FDG PET/MDCT image to assess plaque 18F-FDG uptake, which was normalized for blood 18F-FDG uptake, resulting in a TBR (D).

