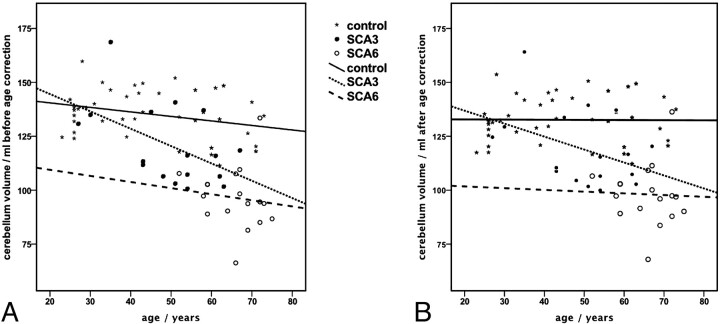
Fig 2.
Effect of the correction for natural aging on the cerebellum volume. Lines represent the linear regression within the control group and SCA subgroups of age. Cerebellar volumes before (A) and after (B) age correction; age dependence is fully compensated in the control group and reduced in the patient groups.

